Bigger Bounce Before Next Leg Lower
 By
By
In our report last weekend, we wrote: "We seem to be in a countertrend bounce right now which when complete should most likely begin another leg lower. As I noted last week, I am still looking for somewhere in the 3200/3000 area at a minimum before this is over....With our composite signal on the sell side and odds also supporting the signal, we are in a short trade right now."
What actually happened is that price could not even make it to the 3450 area on the Emini S&P 500 before turning lower and ending the week near the lows. We exited our short trade with 1.8% gains on Friday due to odds turning from acceptable to low odds on the trade.
What's next? Internals continue to look bearish. Options data is toward the neutral side, maybe slightly bullish. But the options razzmatazz waves are still showing bearish structures on the chart. Price action is choppy but bearish in the short and and medium term. Long term is neutral/consolidating lower after the one-way rally higher. Our composite signal is still short, although the odds on the short side turned to low/cash on Friday and we exited our short trade due to this. I think we may be close to some kind of bigger bounce in the market maybe up to the 3480 area before we turn back lower again. This is assuming we hold this general area of support in the market. If we do get that bounce/rally back up to the 3480 area in the coming week, which is also Monthly OPEX and Fed week, then that should set up the next leg lower toward the 3100/3000 area as we go into the end of the month/beginning of October.
Pivots/Zones: Grey zone resistance is at 3356-65, 3415-27, 3451-63 and then at 3481-92. Support is at 3300-3282, and then at 3278-68.
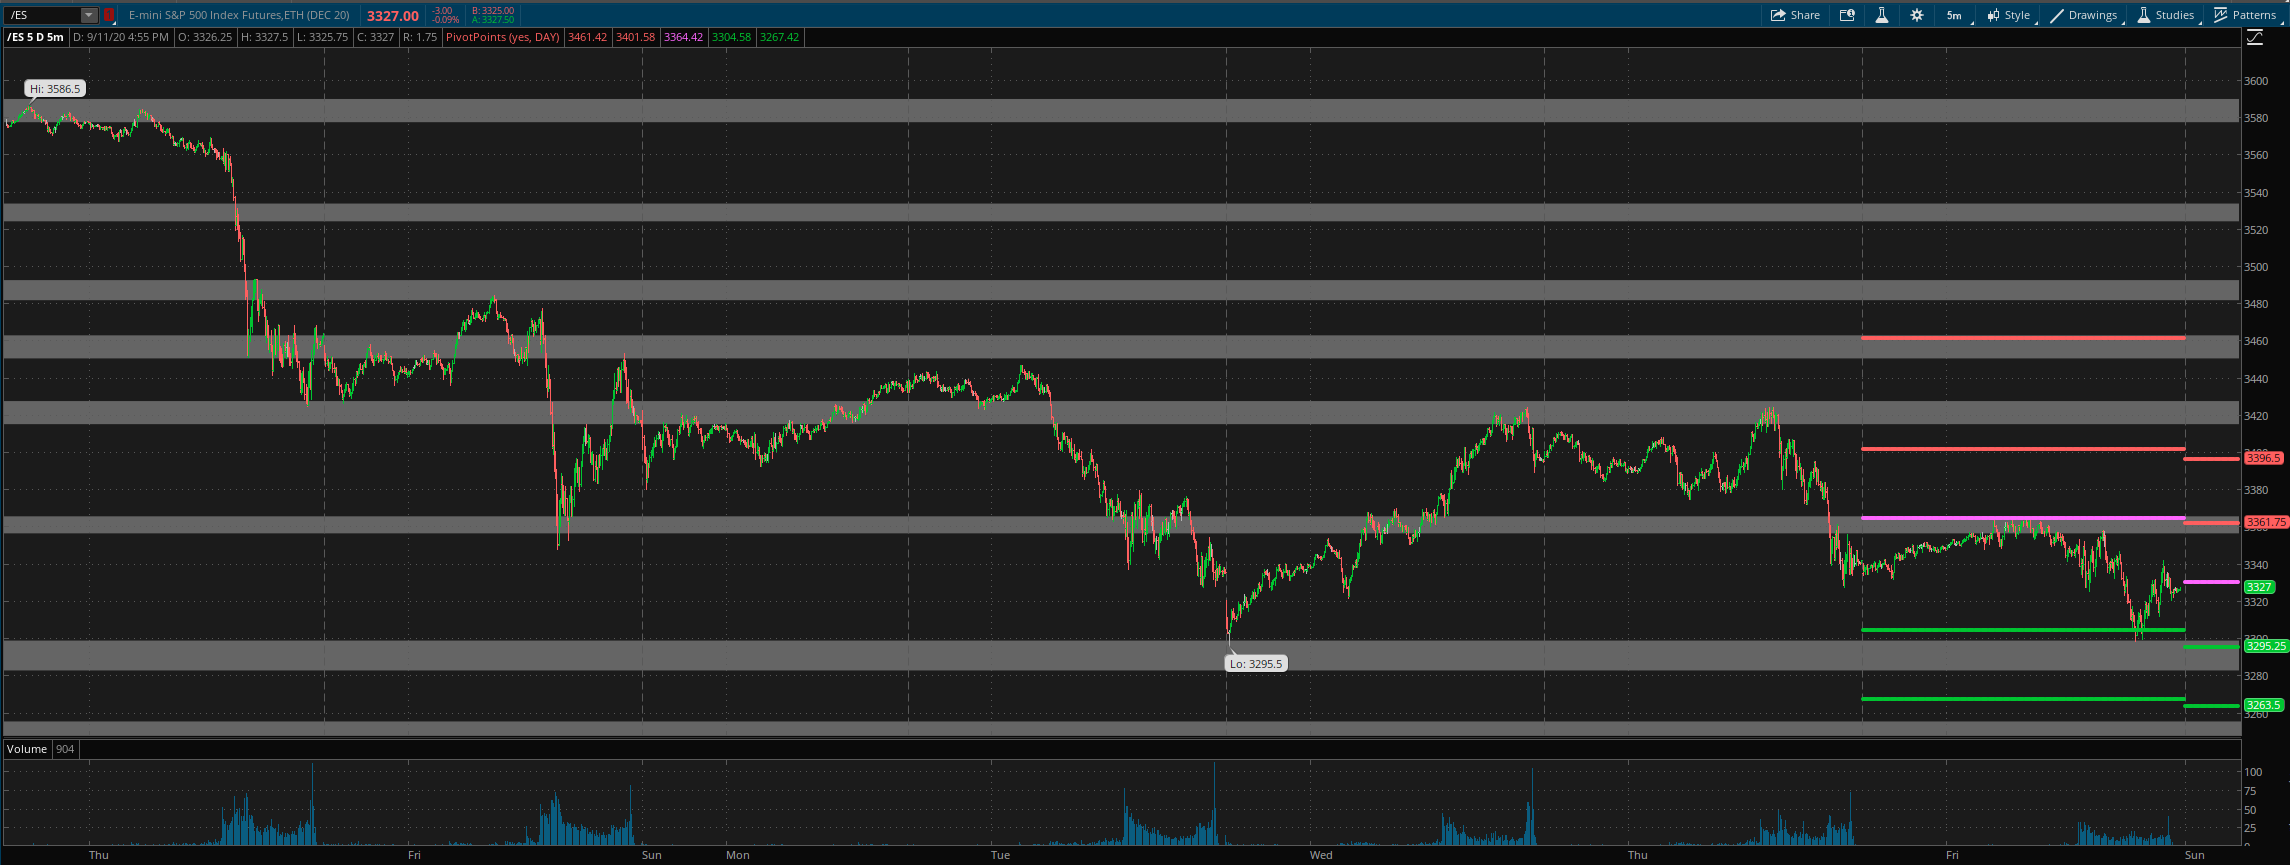
For Monday, daily pivot is at 3330. Resistance R1 is at 3362 and R2 at 3396.5. Support S1 is at 3295 and S2 at 3263.5.
All the best to your trading week ahead.
