Bears May Still Have Some More Pain Ahead
 By
By
In last weekend’s update, I noted that the Emini S&P 500 (ES) was "getting very close to the bigger timeframe resistance zone at 2809-25."
The update went on to say: "As I have been saying for a while, it is tough for me to see us exceeding this without some sort of consolidation or a bigger pullback lasting for more than a few days. Even if we do not pullback a lot, there should at least be some consolidation in time before we can advance further. Note that all of our models we follow in the Smart money room still remain on a buy - I have been cautioning against shorting since Jan 14th when NYHL1M went to a buy - no change in this cautionary view but I do need to see some kind of pullback materialize before committing capital back to the long side.
While we advanced 15 points on the week, it was mostly a bigger consolidation type of move between 2800 and 2760.
What's next?
We are still below the bigger timeframe resistance zone at 2809-25. I have been noting for a while that it is tough for me to see us exceeding this without some sort of consolidation or a bigger pullback lasting for more than a few days. And even if we do not pullback a lot, there should at least be some consolidation in time before we can advance further.
While I still would like to see a bigger pullback materialize here below the 2809-25 zone, the fact that we consolidated in a narrow zone last week giving nothing much to the bears makes me question if something more bullish can happen here. Imagine how many stops are placed right above the 2809-25 zone? It would be just like the market to take them out, remove a majority of shorts out of the equation in a short covering rally lasting 50-60 points higher, and THEN reverse for our bigger pullback. Just speculation for now but I could see this happening.
Add to that the fact that all models remain on a buy signal. Our NYHL1M indicator (which is based on the cumulative value of new highs and new lows on the NYSE) is still looking strong. If there is weakness ahead, I expect to see some signs in internals that things are cooling off, but this is not the case…YET. This makes me think bears have some more pain ahead. Get through the 2809-25 triple top zone and 2880-2900 zone opens up.
Here are a couple of charts from The Smart Money room:
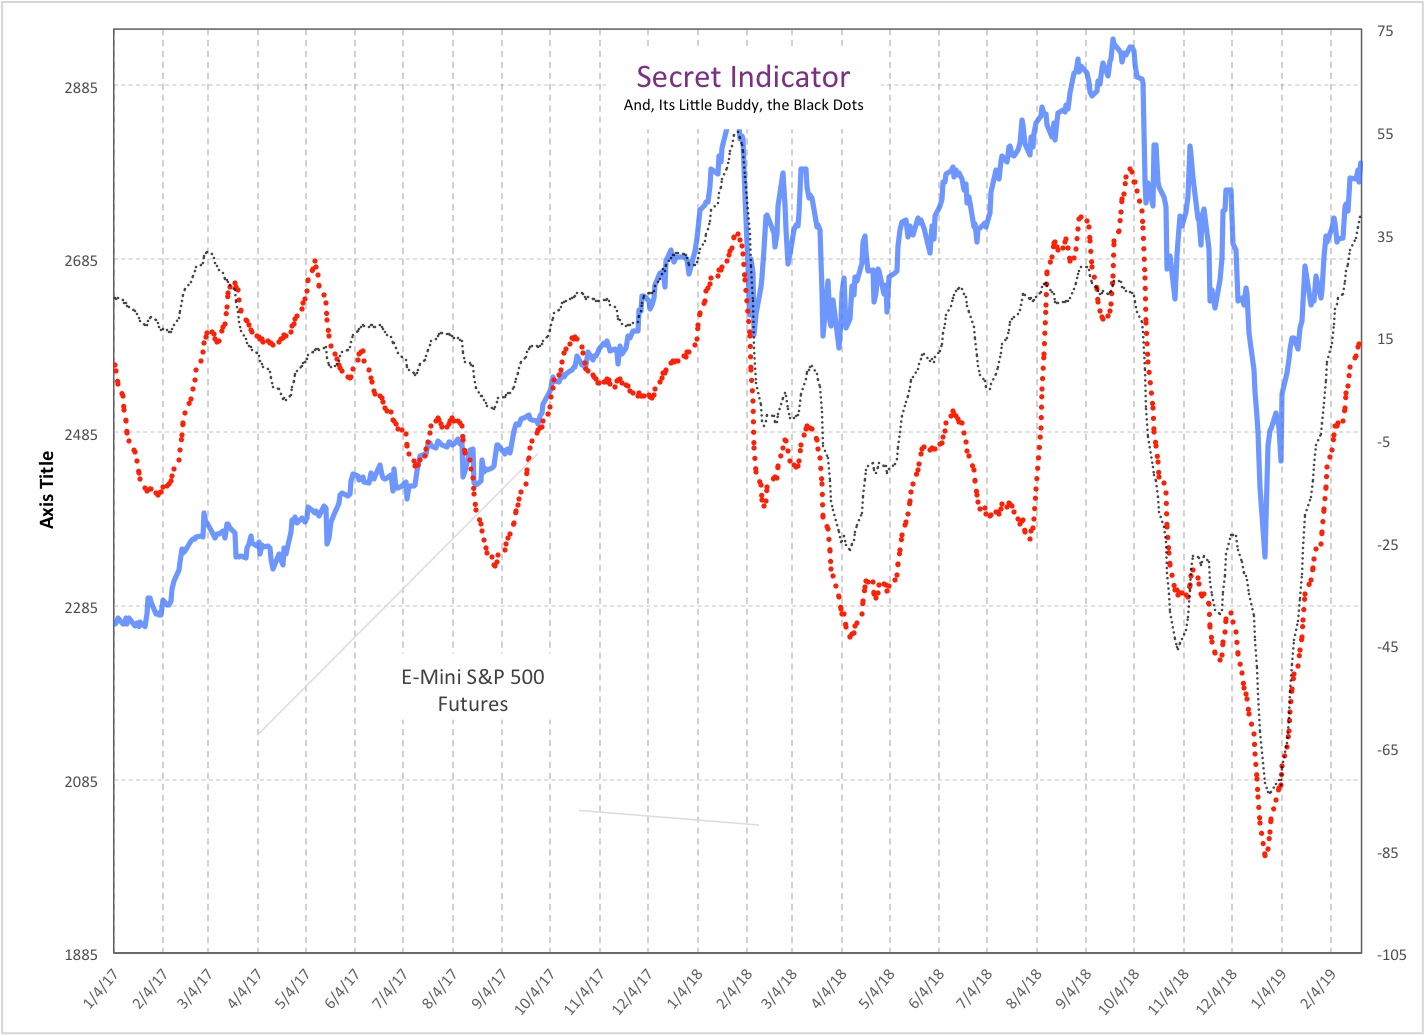
Secret indicator combo - Trend UP : The secret indicator and the black dots continued to tick higher. Trend is UP as measured by these indicators. And it has been for pretty much this whole rally since the Dec lows. There was a day or two of whipsaw in between but for the most part this model has been steadfastly bullish throughout this rally.
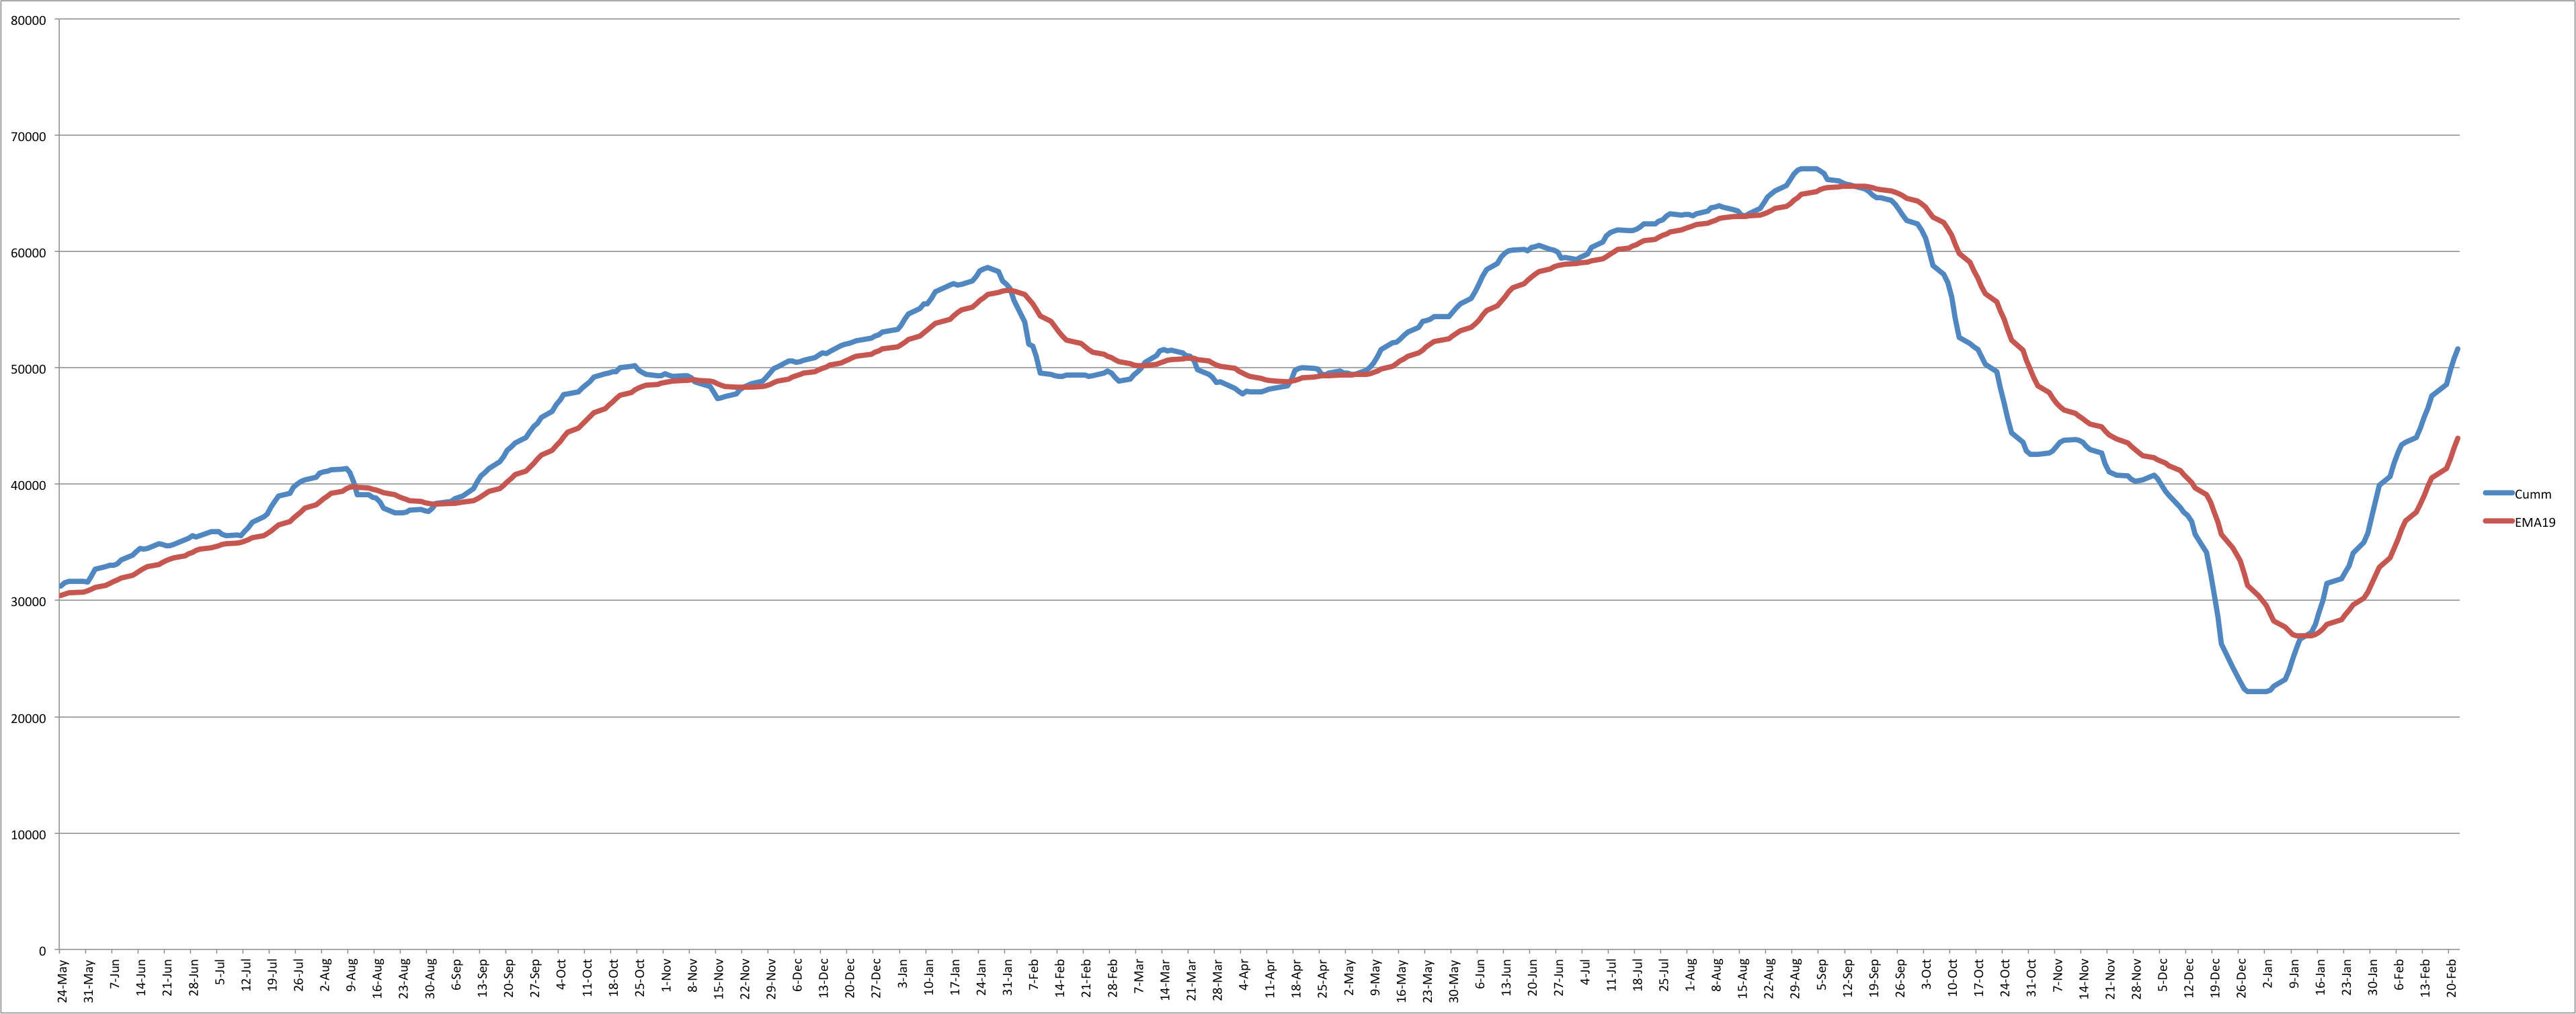
NYHL1M positional setup is still on a buy and it continues to power on higher. Internals continue to look strong here. This model turned to a buy signal on Jan 14th and has remained long since then. (It was short from Sept 14th last year to Jan 14th this year before our buy signal on the 14th)
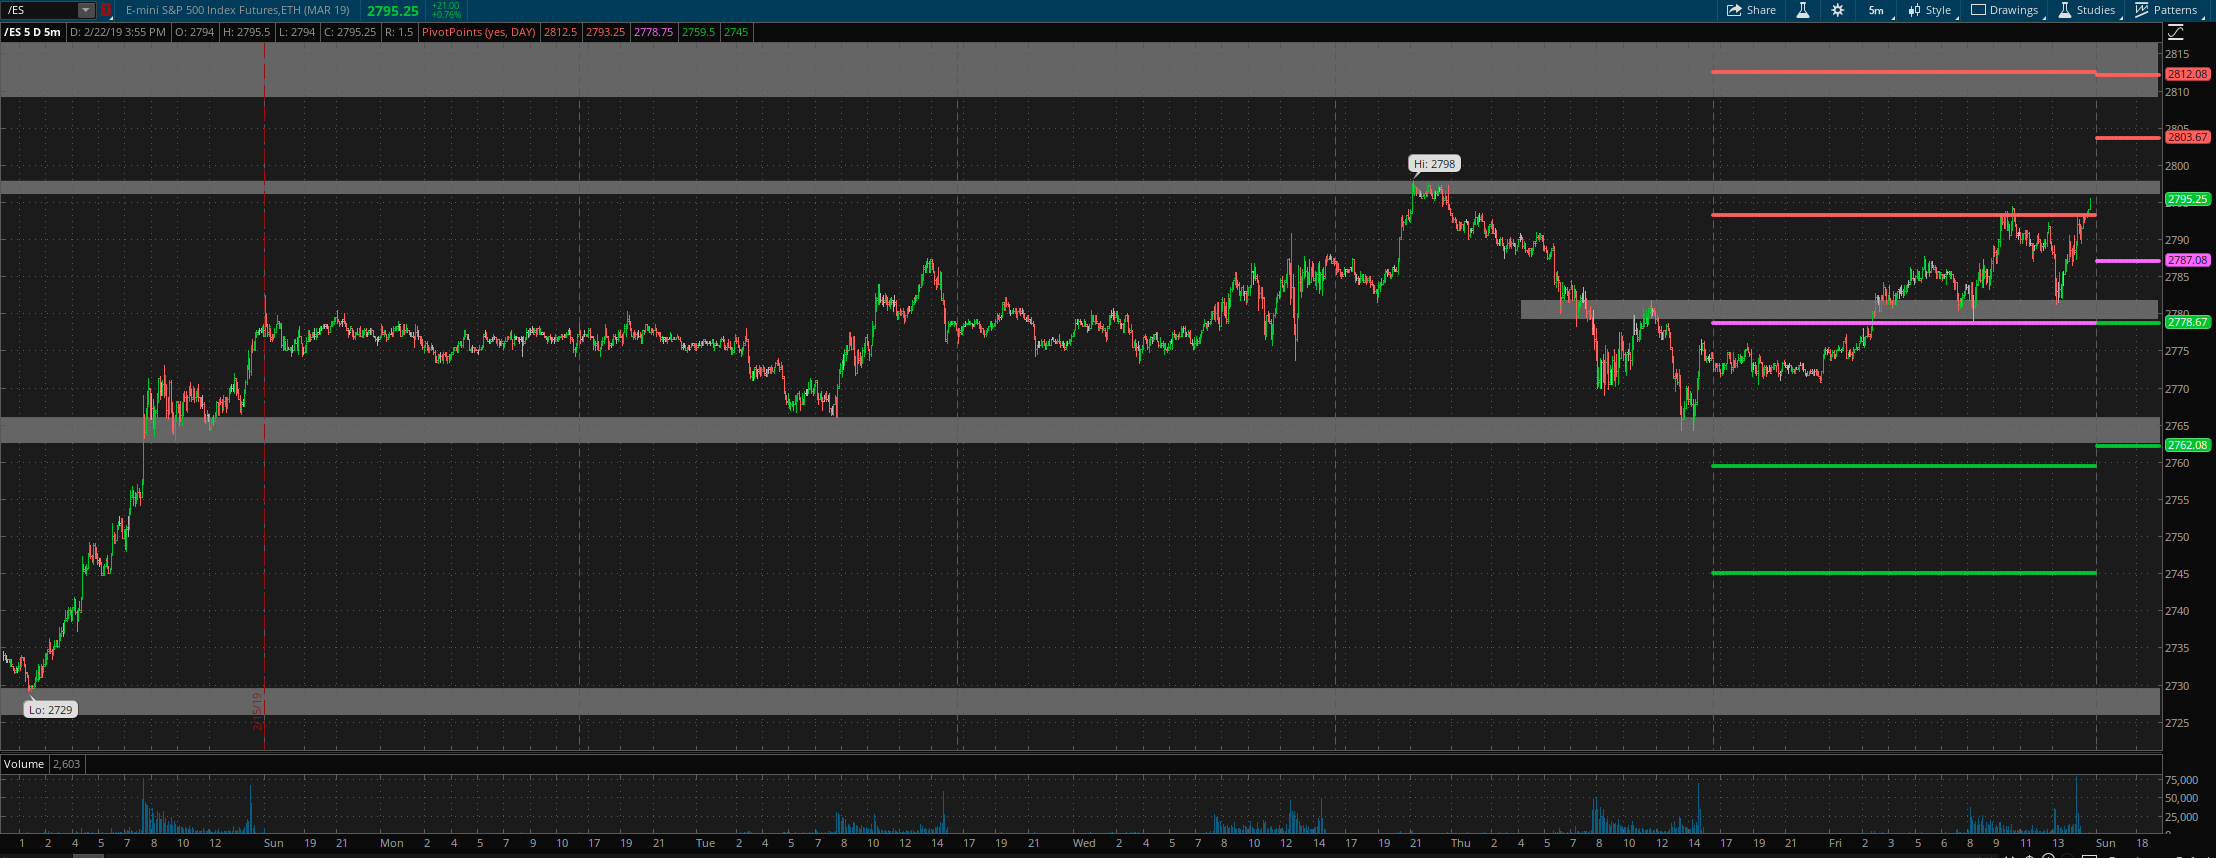
ES Grey Zone areas - We are right below the first resistance zone of 2796-98, second area is the major one at 2809-25. On the downside, we have support at 2782-79 and then 2765-58, then 2730-27.
2765-58 is the most important support right now and bulls hold the upper hand as long as this holds. Break this and we likely have a quick move lower to 2730/2720 area.
ES daily pivot is at 2787. Resistance R1 is at 2803.5 and R2 is at 2812. Support S1 is at 2779 and S2 is at 2762.
All the best to your trading week ahead.
