Bears Drop Ball ... Again
 By
By
In last weekend’s update, we wrote: "No real correction yet - in spite of more of our models joining the sell or neutral side. Razzmatazz data still suggests some kind of weakness over the next couple of weeks - so there is still time for the bears to step up and get something going to the downside. As I wrote last week on Friday, price alone is stubbornly holding without breaking down. Logical outcome here would be for price to finally catch up with all of the other data and internals and break down. However there are phases of the market where logic is thrown out of the window and this could be one of those - bears need price to break down soon else there is a chance that this also turns into some sort of sideways consolidation before a year end rally. This is not my preference and I am still looking for a bearish resolution at least in the very short term - as long as micro1 stays on sell - but the window of time for a bearish resolution to play out is rapidly closing. On price itself, we are rangebound for now but above 3119, bulls can take it higher for a retest of the highs or more… below 3090, bears can take it lower for a test of 3075 and lower. We will continue to use the micro1 indicator to guide us in our trading.
What actually happened is the S&P 500 got above 3119 on Monday itself -- and a retest of the highs and more followed.
What next? Bears dropped the ball once again, and with that most of our models were forced back into buy signals again before the weakness on Friday pushed us out of our trading longs right at the end of the week. Looking at market internals right now, my preference is for some sort of price correction at least over the next few days. But if you look at price and options data, both look bullish and have room to still go higher. If we do decide to consolidate or reset lower for a few days, I would expect 3090-3100 area to hold on any pullbacks and for us to continue higher again after that reset and maybe get closer to 3200 on the next advance.
As long as 3090 holds, this would be my expectation. Break of 3090 would be the first sign that we are going for a deeper correction into the 2950 zone. But for now, not much supports this deep of a correction -- so let us expect the path of least resistance to be higher. And we will continue to use the NYHL1M micro1 indicator to position alongside this path.
ES Grey Zone areas: The grey zones on the ES 5 min chart below are what I draw in on a discretionary basis - they are supports and resistance areas which the market is most likely to react from. If we test a zone from below, it is likely to be rejected and fall lower to test support zones below. If we test a zone from above, it is likely to take support there and begin a move higher. So these zones can be used for intraday trading and/or as entry points for positioning for swing trades. These zones are drawn in based on what the market has done there previously both on smaller and larger timeframes.
Grey zone resistance at 3151-55 and then at 3163-68. Support is at 3142-37, 3130-26 and then 3116-12.
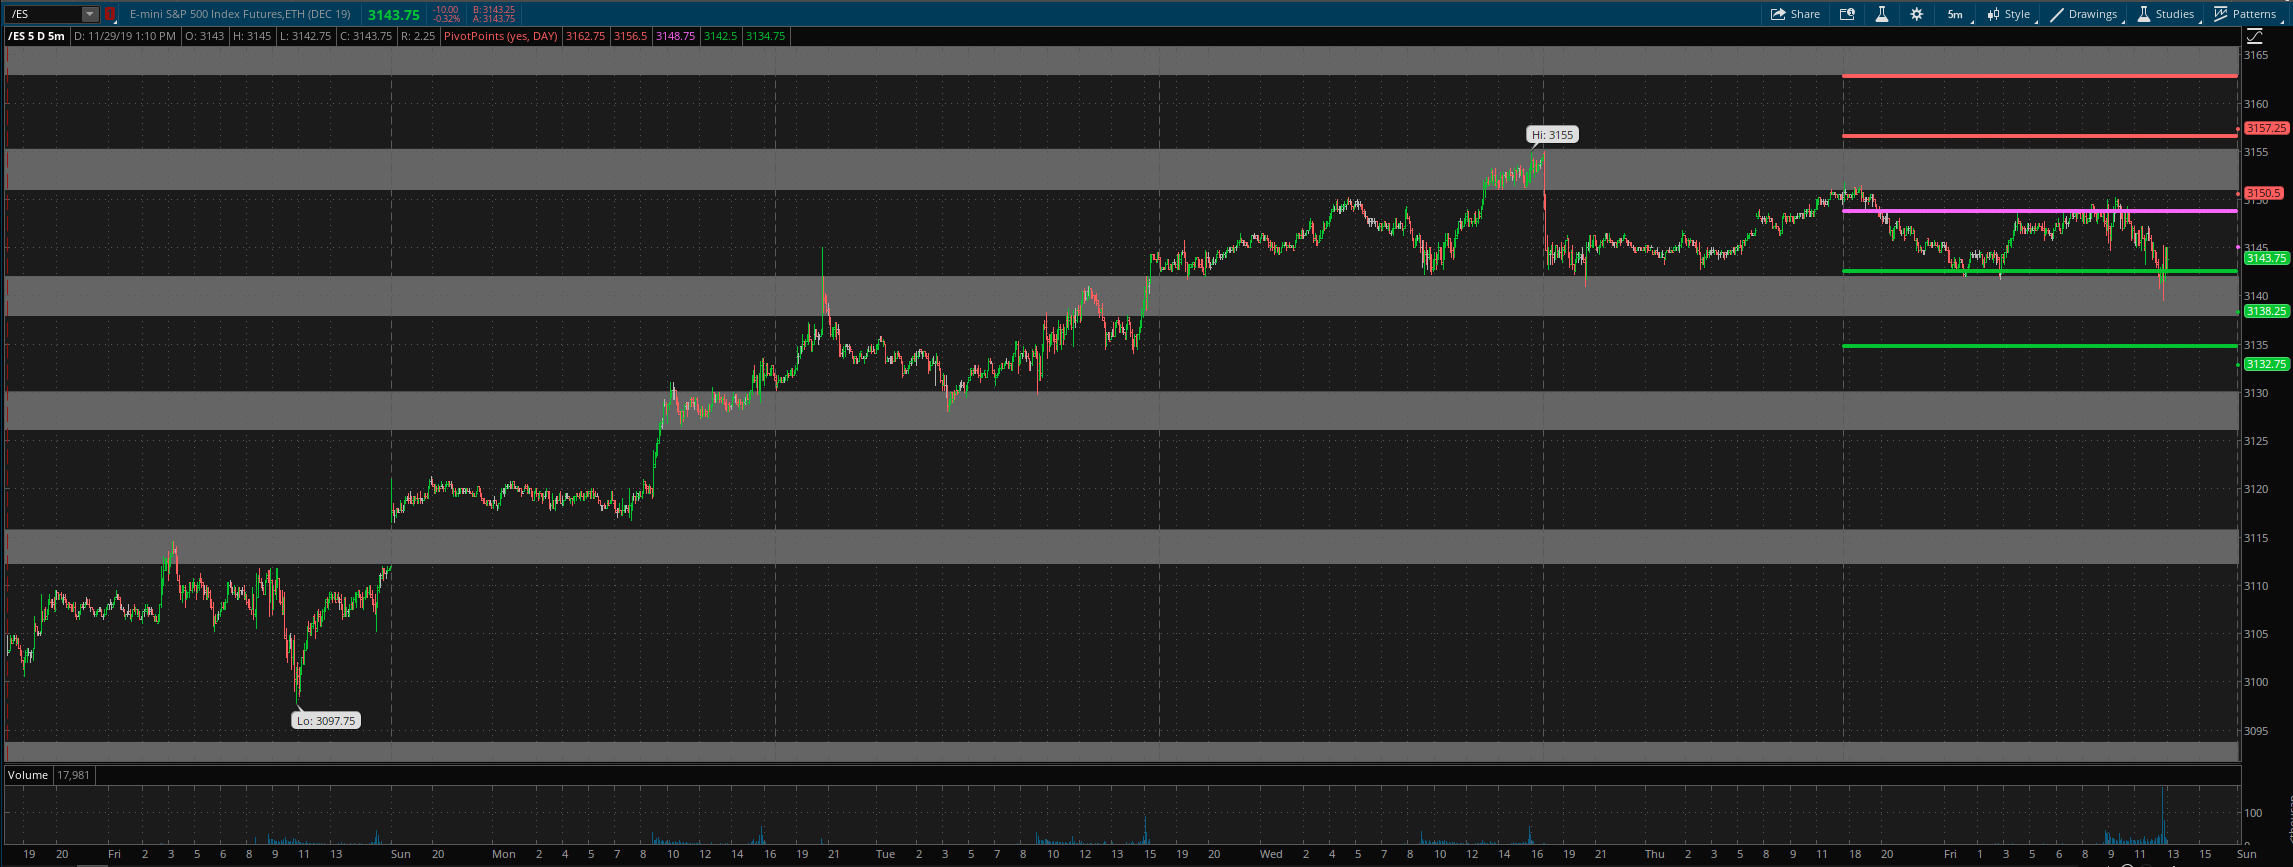
Daily pivot is at 3145. Resistance R1 is at 3151 and R2 at 3157. Support S1 is at 3138 and S2 at 31.
All the best to your trading week ahead.
