Bearish on Longer Timeframes
 By
By
I want to take a step back for a second and reiterate my bigger picture thoughts. I could be wrong since this is purely anecdotal, but it really seems like this rally off the June low has forced a lot of bears to throw in the towel, and abandon their short position. The shape and speed of the rally reeks of short covering too. I also see a lot of EW counts suggesting that we have a 1-2 in place now off the December low, and this rally is the start to a much bigger 3rd (which would project to at least 3750 SPX if that is the case, keep the scope of that move in mind).
Is that path technically possible? Of course, anything is possible and we should always be mindful of potential outcomes for the market based on our technical analysis. However, we deal in probabilities, and I continue to see little to no evidence across the wide array of charts that I track on a regular basis to strongly support that potential. From various individual stocks and sectors, to inter-market relationships, to foreign country and world indexes, there are so many charts that argue for the exact opposite. The vast majority of charts argue for a 30% correction looming, not a 30% rally from here in my opinion.
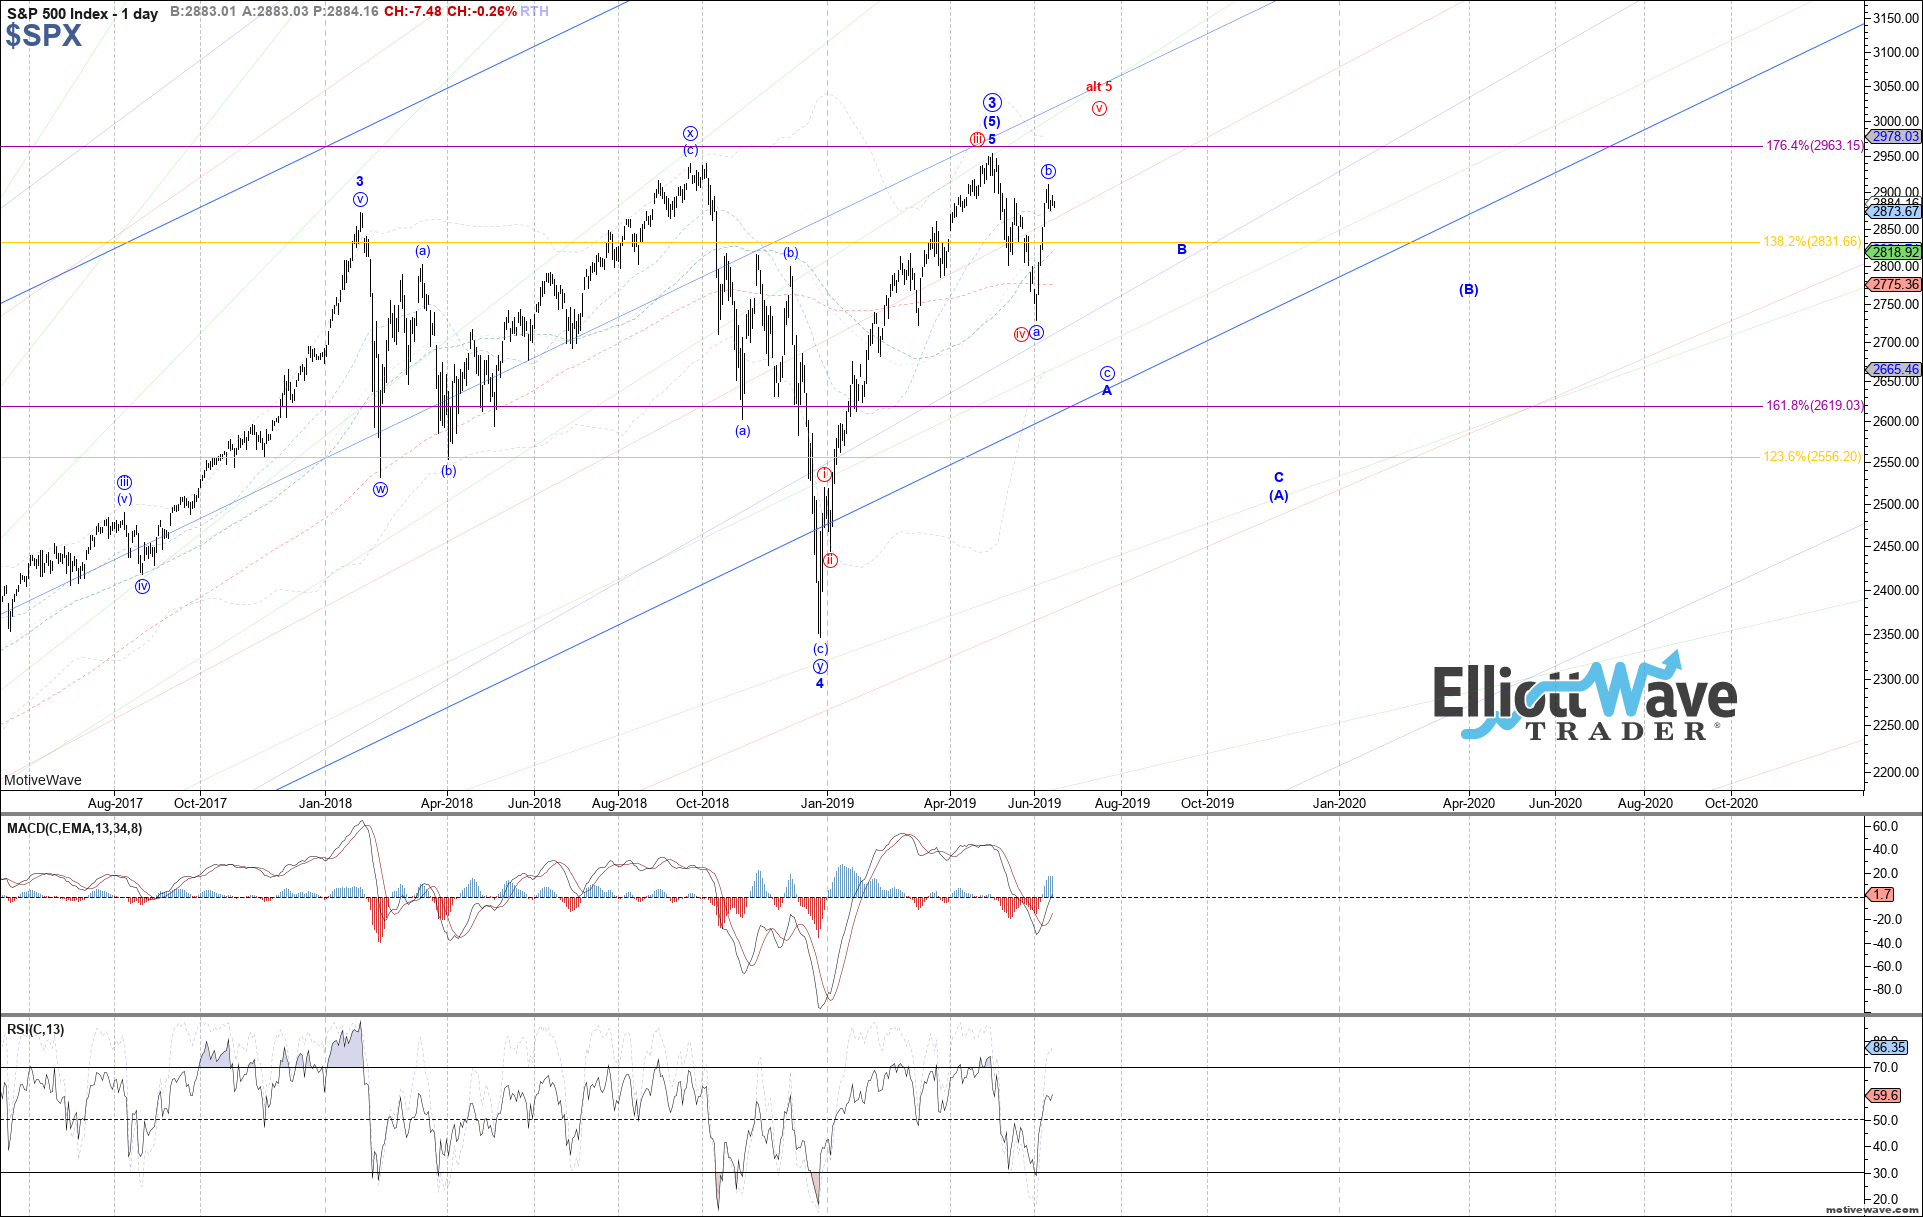
Will this thesis be correct? Only time will tell, but until I see the evidence necessary to reconsider my outlook, I will continue to be bearish on longer time-frames. The most bullish I can get at the moment is the red count shown on my SPX chart, which suggests that this 5th wave off the December low has not completed, and can make one marginally higher high toward ~3000 before the music stops. Below the June low and I think this market is cooked.