BTC: Top in Place, But Top of What?
 By
Jason Appel
By
Jason Appel
BTC: Top in place, but top of what?
In last week's article the title, "The Top?" pondered just that: whether Bitcoin had topped just shy of $124.3k. Given the downside followthrough in the past week, which culminated in a breach of the previous August low, it's clear that some sort of top is reasonably in place but of what significance? Or, what degree of top do we have?
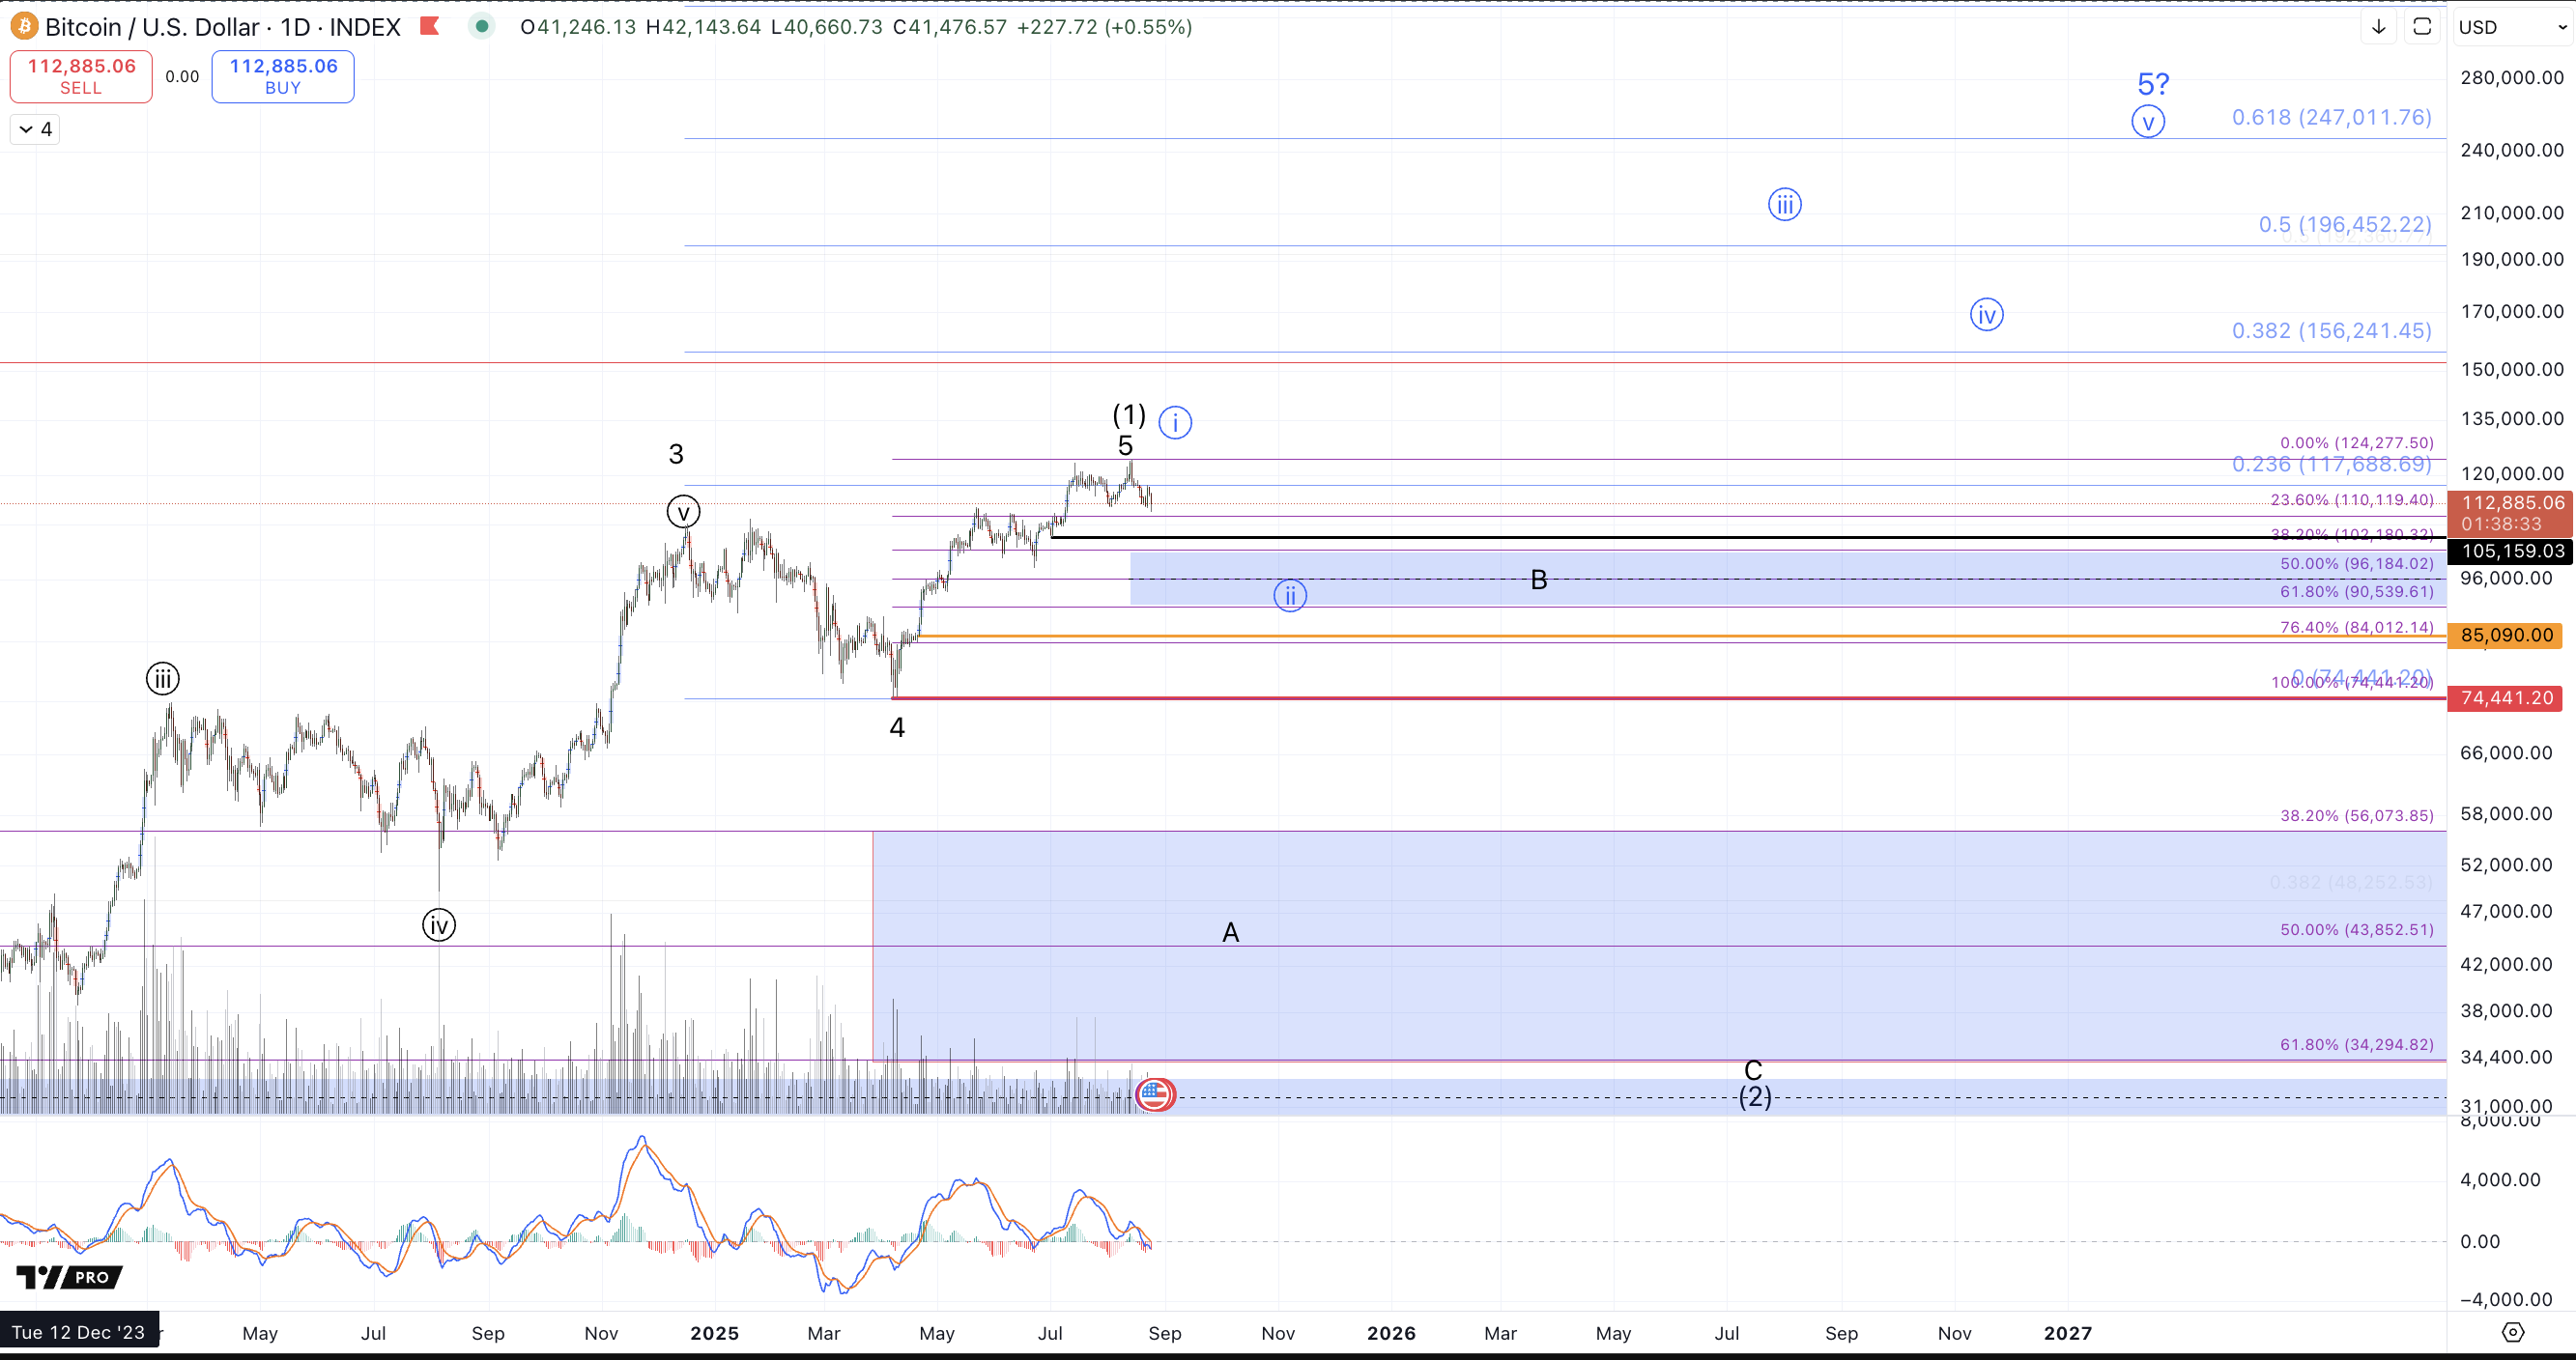
I'm going to provide some detail to fill in the colored labels on the accompanying charts with a discussion of key levels that will increase the odds of various cases. For now, I'm treating the count shown in black as primary though I can hardly state that this perspective contains much conviction. For instance, I weight the probability of this outcome no higher than what's presented in blue (more details on that later). The black count entails that THE TOP is in meaning that price has completed the entire rally from the 2022 low and we will not see this level breached for another year+. Again please consider the quasi-disclaimer just stated..."I can hardly state that this perspective contains much conviction."
In this black count expectations are for a multi-month or even reasonably a year+ pullback to occur which can ideally retest the breakout region from October 2023, roughly between $30k-$35k which would also consequently test the April and July 2023 highs (from above) that were broken out from in October of 2023. From an analysis perspective there is still much support to break in order to treat this black count's projections as highly confident. However, from a trading standpoint, this count suggests a very risk averse stance here, ie taking profits on trading longs accumulated in this cycle. Also, though I won't provide a granular level of detail on very long term projections within this article, I will state that I have a very bullish long term view on Bitcoin, but that I primarily treat each cycle as a unique trading opportunity rather than considering it part of the large fractal from inception. Nevertheless, I have a very long term bullish view on Bitcoin and I don't expect the 2022 Cycle low to be breached even if price is following the black count and the 2022 Cycle has completed.
So, what needs to occur to more resolutely establish a lasting top in place? Well, the first degree of support has broken with the break below the previous August low around $111.9k, which occurred on Friday 8/22. Also as of writing this article, price has just established a new low in August adding further evidence of a top in place. The break below the 8/2 low technically invalidates last week's green count's potential, though that's not entirely unexpected given that the more immediate breakout scenario was presented as a low probability alternative thesis.
The key support in the current stance is the $90k-$100k region and a successful test of this region is what's displayed in the blue count. This count entails that Bitcoin is just in the early stages of the 5th wave from the 2022 low rather than having completed it. Specifically, the blue count defines the April low to the August high as a wave circle i of 5 and now price filling in the wave ii. So long as price is holding support, I'm effectively neutral between the black and blue counts and would need a break below $85k at a minimum to increase the level of conviction on the black count. The blue count entails a test of the $90k-$100k region, ideally bottoming around the lower end of that region or a bit below $90k before rocketing up in waves circle iii-iv-v to take price up north of $200k to complete this cycle. Again the key levels within this count are our standard Fibonacci support, $90.5k-$102.2k and $85k, a sustained break of which will have me getting much more confident in the black count.
Neutral between black and blue but treating black as primary (for now)
If the blue count is correct, price likely comes down to test $90k. If the black count is correct, price definitely has to come down to $90k (and far below that). Considering how mature this cycle is, I'm choosing my primary thesis as a more risk averse stance here even though I weight the probability of the outcomes to be essentially equal. That is to say, with price still above $110k we have less favorable risk to reward ratios but as price drops down towards $90k, the risk to reward ratio in playing the blue count becomes much more favorable. Ultimately, the dividing line that distinguishes between the two counts is the April low at approximately $74.4k. Below that level and the blue count is technically invalidated.
What about between here, $113.4k as of writing, and the blue wave circle ii support, $90.5k-$102.2k?
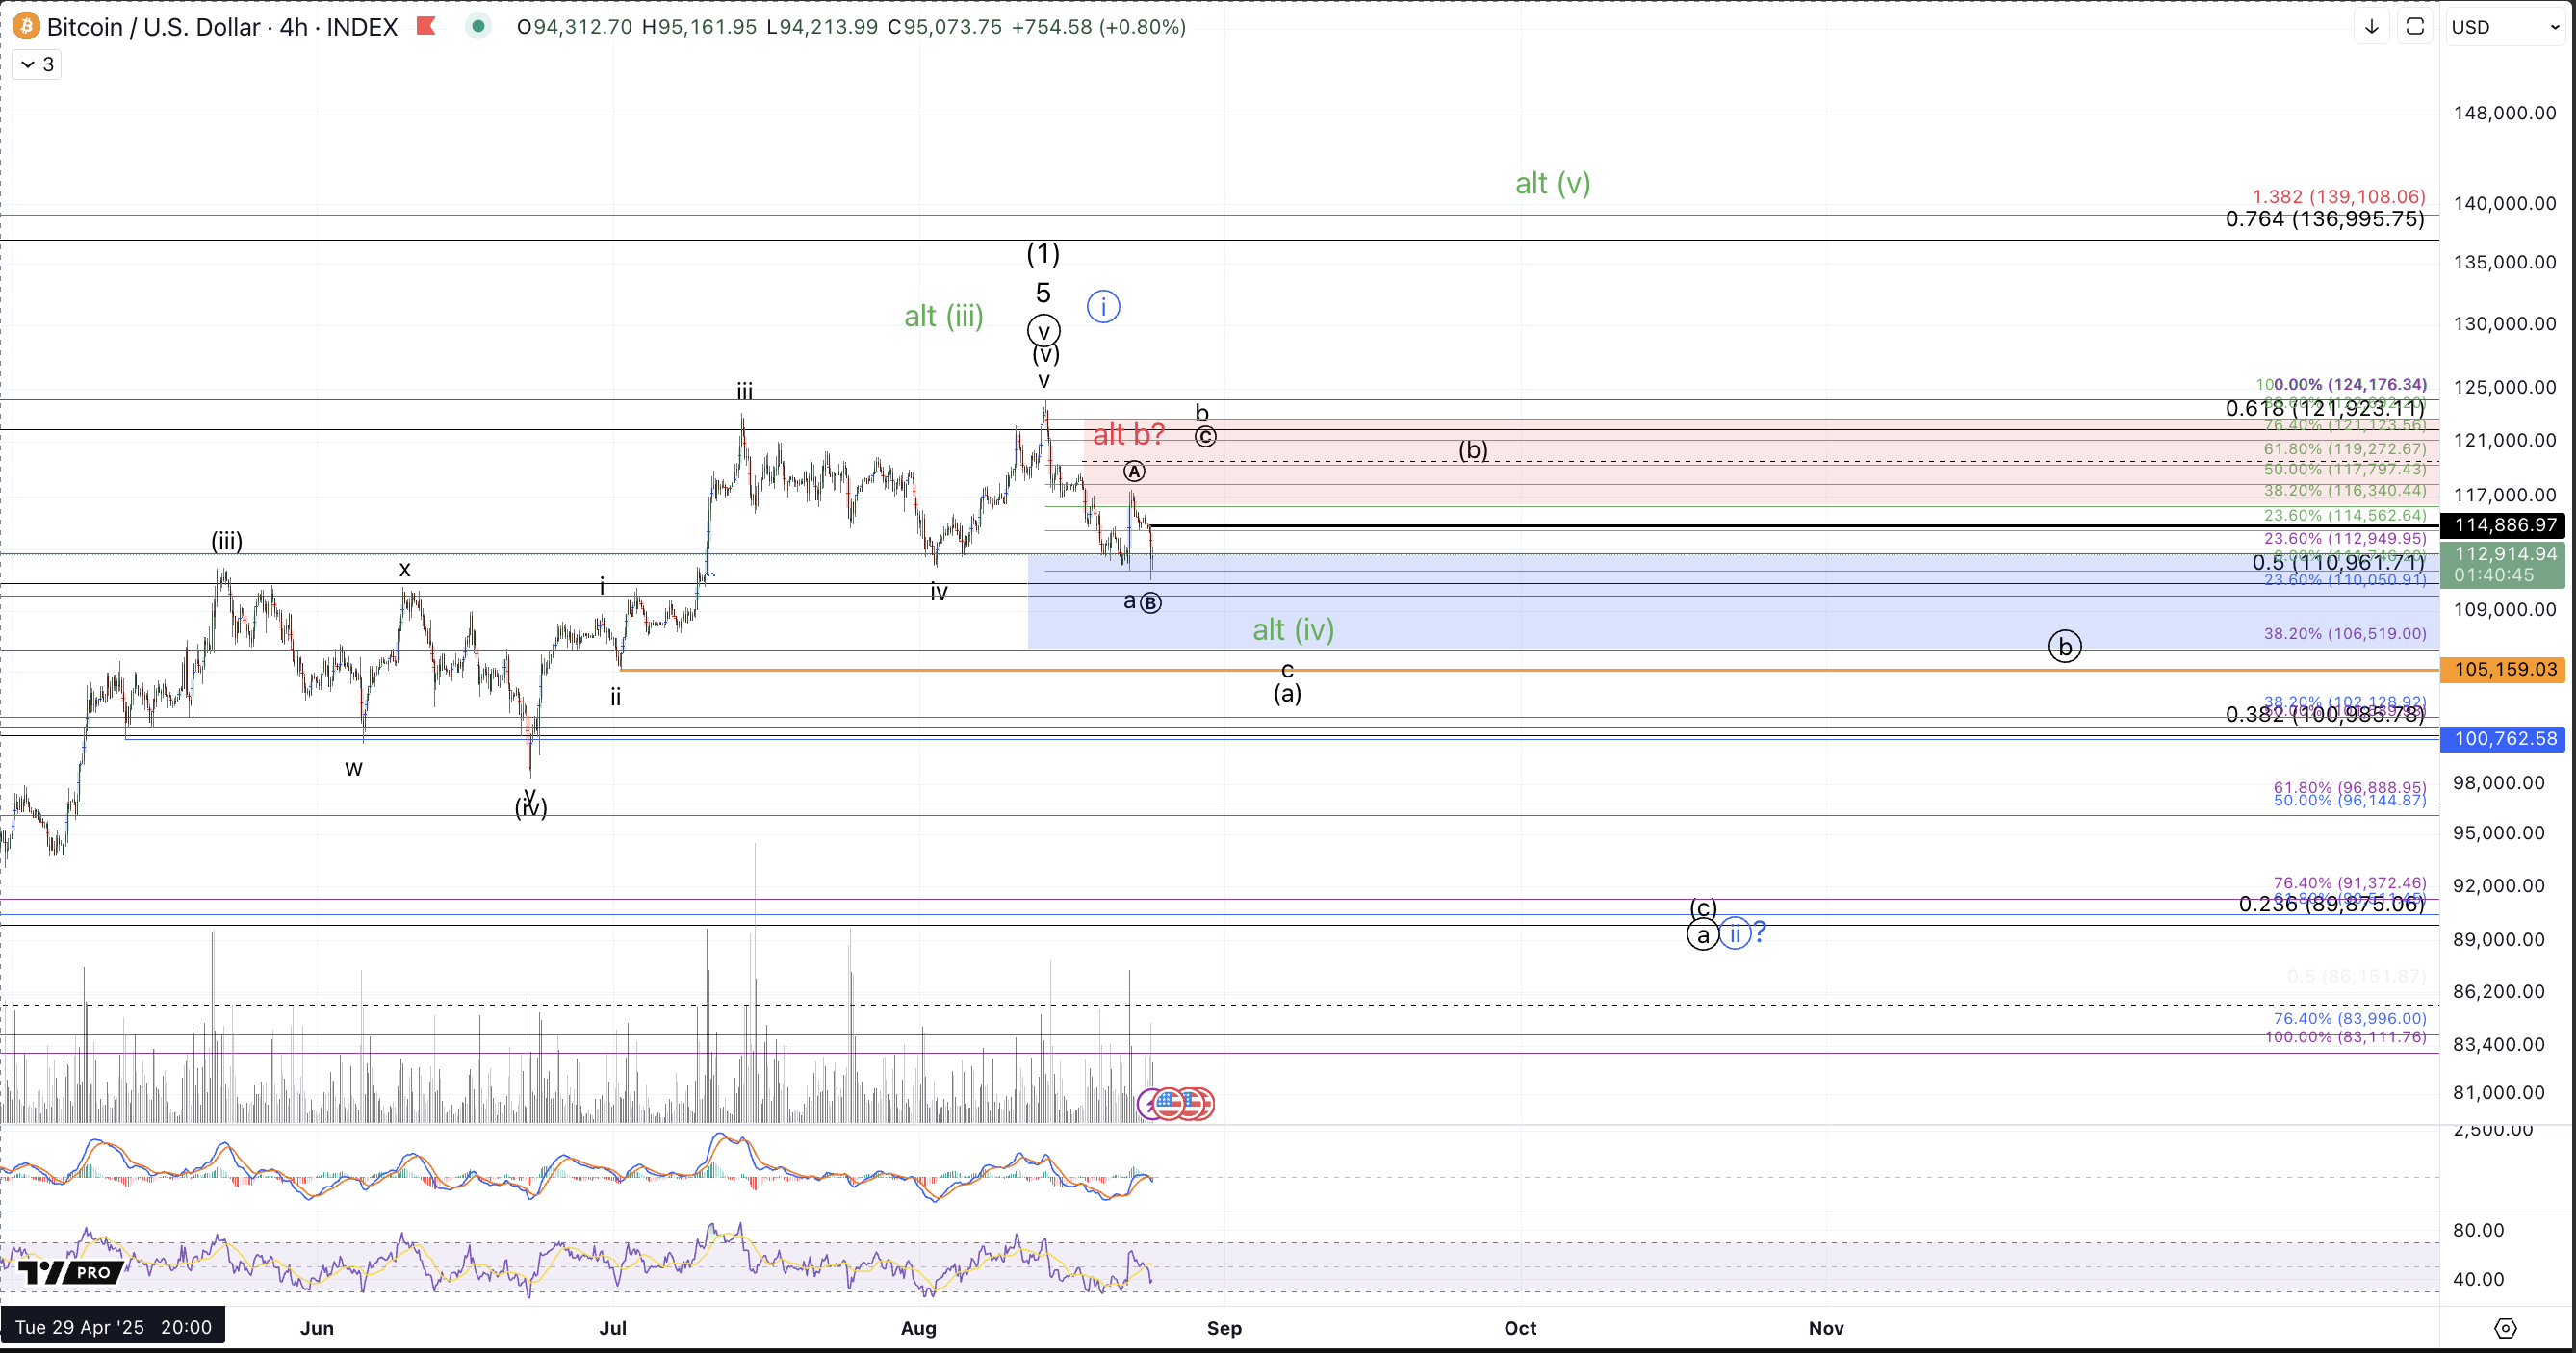
In the current stance I can make a case for the Sunday, Binance news spike, to be an expanded circle B within the subminuette b wave but can't rule out that the Friday high completed all of the subminuette b and price is on its way down to test deeper within the upper support region, $106k-$110k. $114.8k will need to be recovered without breaking the news spike low to provide weight for the smaller degree black count's thesis shown on the 4hr chart, ie, Bitcoin filling in a wider b wave with a circle C higher to retest the $118k-$122k resistance region.
What about the current green count?
Like last week's green count, this is being presented mostly to show what support region must break to increase the odds of the blue and black counts and not to show a thesis that's predicted with any strong degree of confidence. In this case, upper support, $106k-$112k, can be viewed as supporting another more direct run to new All-Time highs. This interpretation, shown on the 4hr chart would entail that the August high was an extended wave (iii) in the move from the June low and that price is filling in the wave (iv) with a wave (v) targeting $130k-$140k to come. So long as price is maintaining the upper support zone, I can't rule out this perspective but to do so will require a resounding break below $105k at which point price would be approaching the shallower end of the key support for the bull market, ie the blue circle ii support in the $90.5k-$102.2k zone.
Expectations for the next few weeks are to see choppy action with two-sided price delivery, ideally up to $118k and then down below $105k. If price fills in a wider correction back into the upper support and develops a micro impulse, I'll become more interested in trading the green count here but for now, I'm looking at the action from a risk-averse stance until $90k is tested