Awaiting Rebound Rally - Market Analysis for Feb 2nd, 2020
 By
By
In last weekend’s update, I wrote: "Our lowest timeframe indicators are bearish and the higher timeframe ones are flashing warning signs. Options data by itself, however, came in bullish on Friday’s action, meaning we had a lot of put activity on the fear generated on Friday. So while my base case is that we have topped and we are going lower over the next few weeks, I cannot rule out the possibility of an immediate retest of the highs. We should get more clues from the option data tomorrow. Our trusty micro1 indicator got us out of longs on Tuesday itself... and we booked 2.4% profit on our QLD longs and are flat right now...On price, I see strong support in the 3250-3235 area and IF we can hold this area, a retest of the highs and even higher is possible… Break that support area and the possibility of a move down to 3000 area becomes a much higher probability. As always, we will use our indicators specifically the micro1 signal to tell us when to get back in on the long side in the market. Until then, patience."
We were right to get out of those longs and use patience, as the Emini S&P 500 (ES) bounced off the 3250/35 zone several times during the week before finally breaking down below it on Friday.
What next? Almost all of our models except for the longer-term ones are on sells right now. Price finally broke below the 3235 support zone on Friday and we should test the 3180 support zone next. We should have some more bearish action ahead of us this coming week, but I think we should begin looking for bottoming signs very soon, at least for a rebound rally. I like the 3150 area for a potential bottom, but if we fail there, 3050/25 area becomes the next zone we can target for a low.
We are flat right now. Our micro1 indicator went to a sell on January 21st getting us out of longs very near the all-time highs before the move lower began. And we are waiting for it to go back to a buy to get back in long. No need to overthink things -- just wait for the next signal and execute the trade when it happens. Completely stress free trading based on proven and backtested rules.
ES Grey Zone areas: The grey zones on the ES 5 min chart below are what I draw in on a discretionary basis - they are supports and resistance areas which the market is most likely to react from. If we test a zone from below, it is likely to be rejected and fall lower to test support zones below. If we test a zone from above, it is likely to take support there and begin a move higher. So these zones can be used for intraday trading and/or as entry points for positioning for swing trades. These zones are drawn in based on what the market has done there previously both on smaller and larger timeframes.
Grey zone resistance at at 3233-42, 3264-70 and at 3292-3300 area. Support is at 3212-07, 3184-79 and then at 3154-48 area.
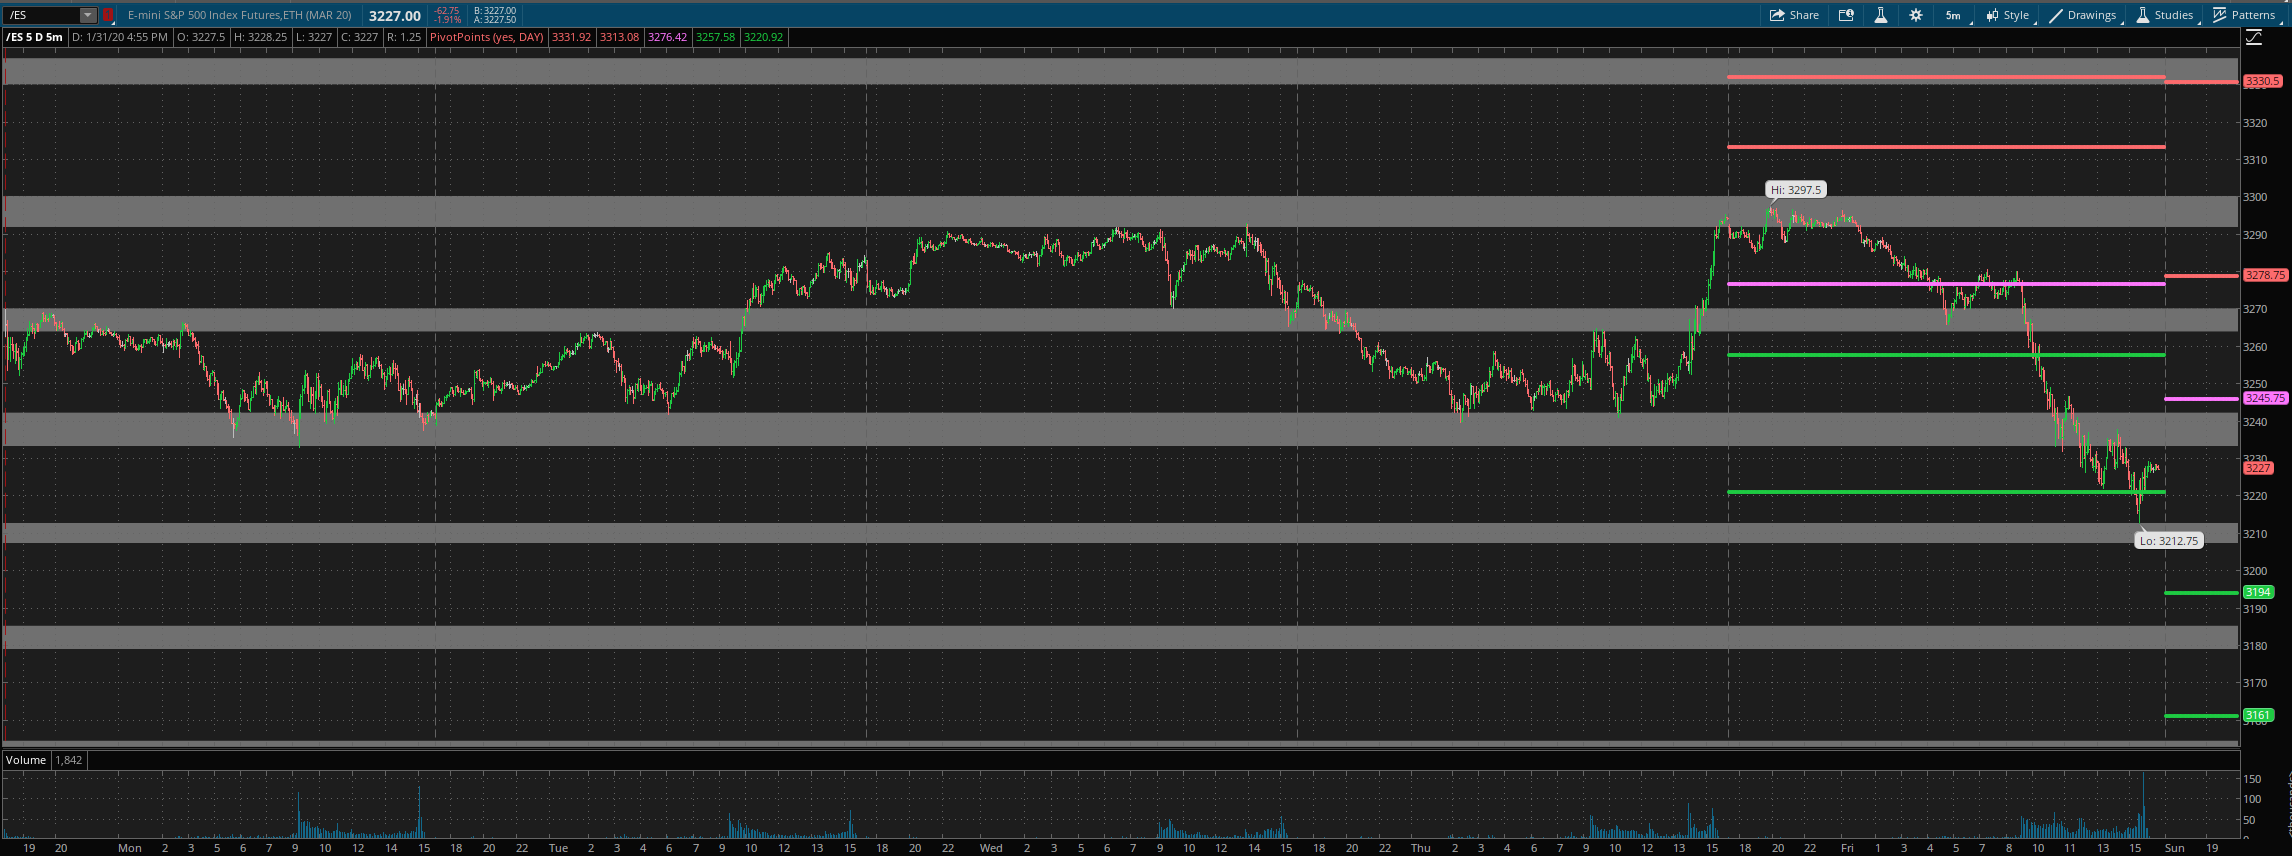
Daily pivot is at 3246. Resistance R1 is at 3279 and R2 at 3330.5. Support S1 is at 3194 and S2 at 3161.
All the best to your trading week ahead.
