Approaching Levels For the Last Big Swing Long of the Cycle From 2022
 By
Jason Appel
By
Jason Appel
Over this past week, Bitcoin has declined in a manner that's provided initial followthrough on the downside structure shown in last week's article. The key aspect here is that price has now breached the 6/5 low which invalidates the immediate upside that was shown in green.
Perhaps more importantly, this break below the 6/5 low further increases the odds of the bigger potential circle i-ii off the April low. As a reminder, this perspective was first introduced in the 6/4 article "Support for this perspective is $87k-$96k and a successful test of this region could launch Bitcoin much higher, into $250k+ for a big 5th wave to complete the cycle from 2022."
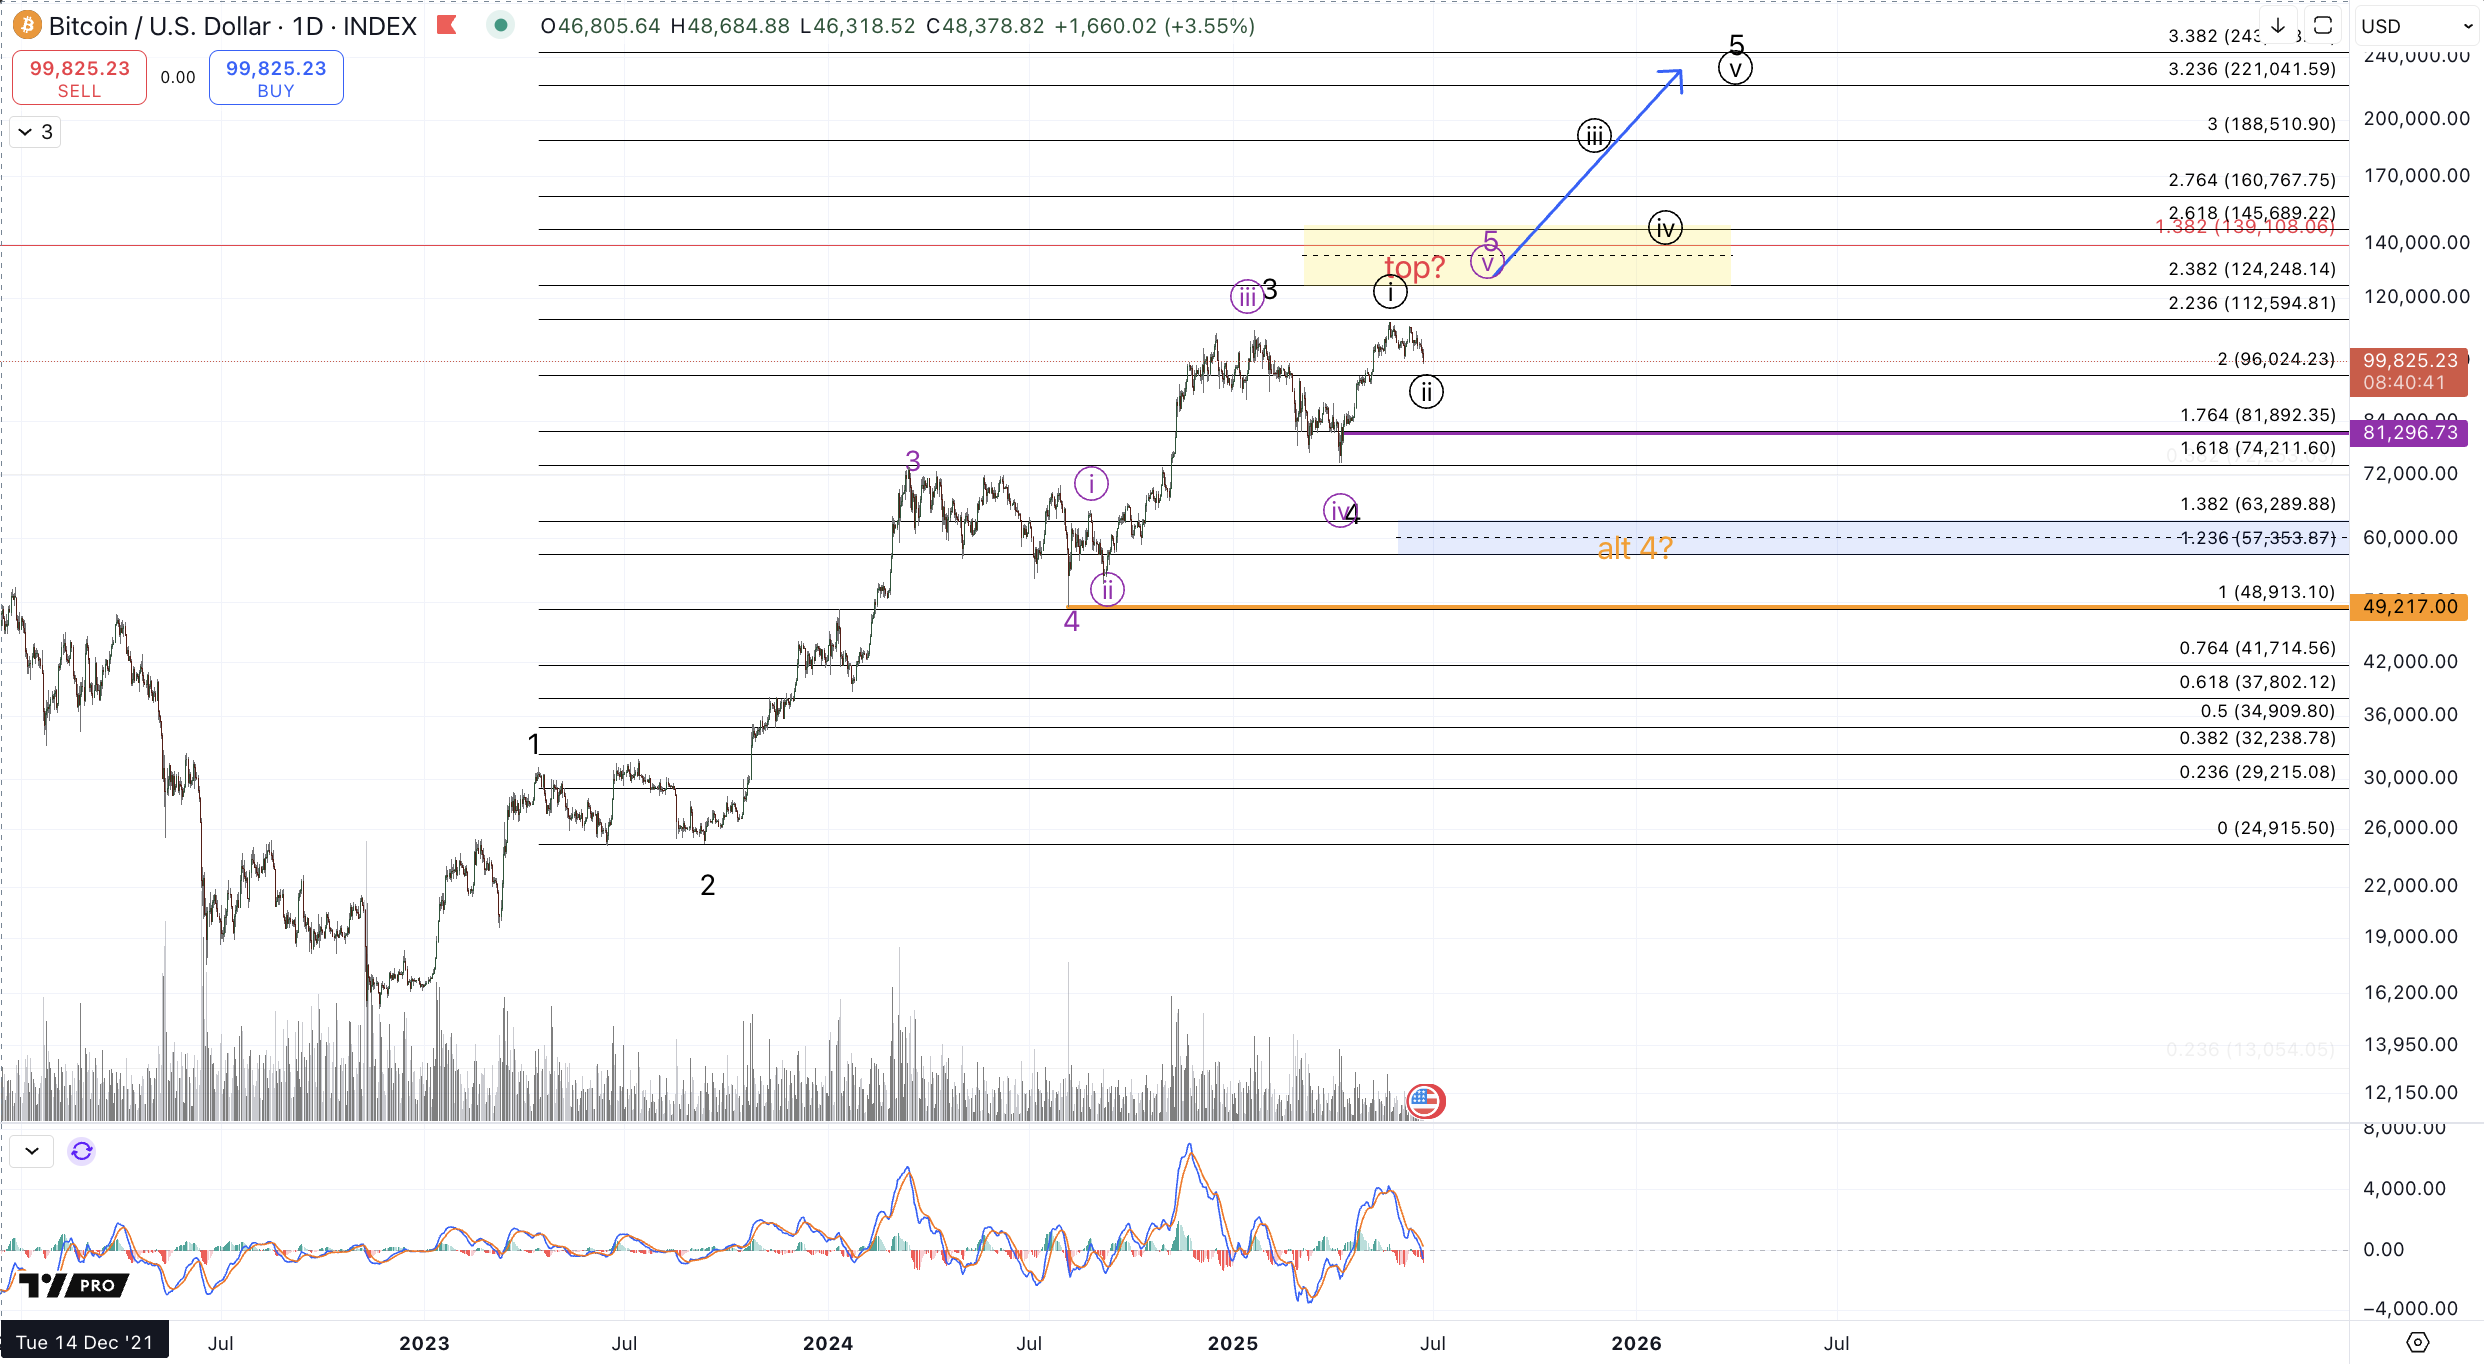
Let's take a review of the bigger pattern considering the daily chart. In this chart are two very reasonable interpretations of the move from the 2022 low:
The black count suggests that the December/January highs struck a top to an extended 3rd wave and the pullback into April completed a slightly shallow but standard 4th wave with a hit of the 23.6% retracement of the rally from the September 2023 low, ie, the wave 3 in the black count. The subsequent rally from the April low to the May high, reaching a new all-time high slightly above that which was struck in January is thus wave circle i of a big 5th wave setting up for $200k+ and more ideally, extension to $250k.
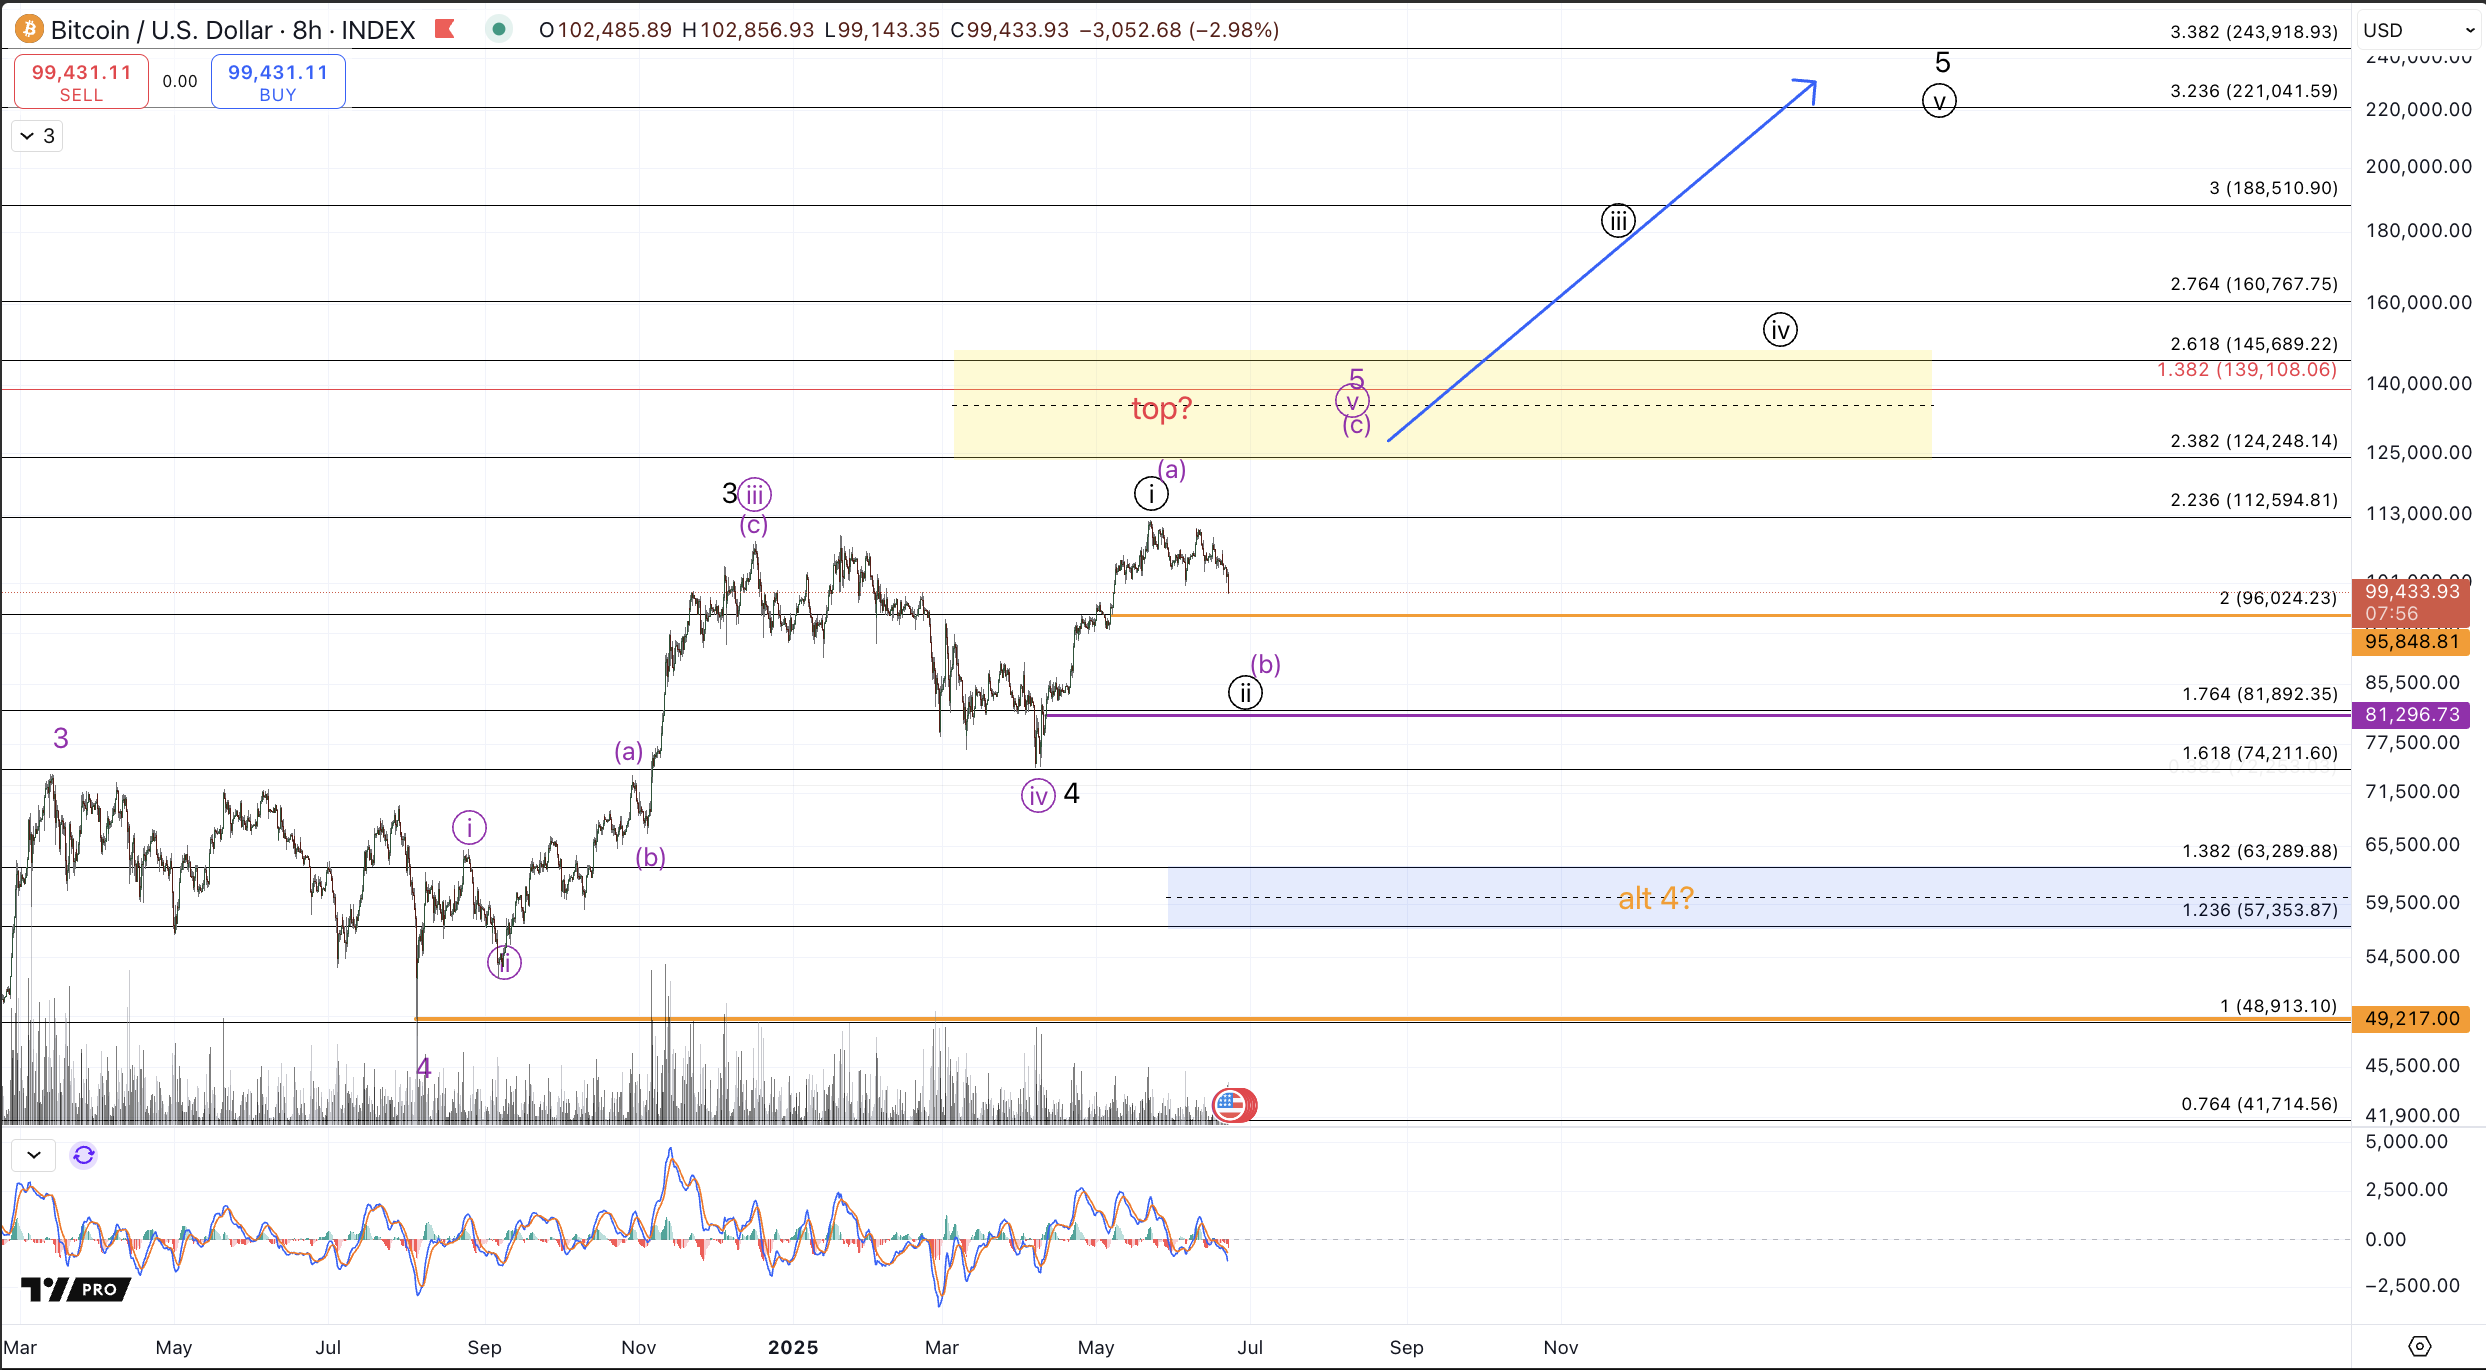
The purple count suggests that the rally which concluded in March of 2024 completed a standard size wave 3, with the hit of the 1.618 extension and turndown to the August low which entails a standard 4th wave, considering its conclusion at the 1.0 extension of the larger 1-2. The subsequent move from the August 2024 low to the December/January highs can then be interpreted as waves (circle) i, ii, and iii of a protracted ending diagonal wave 5 from the August 2024 low. On the smaller degree this would entail two different potentials. First, the bearish potential, is that price has completed the rally from the April low which in turn completes all of the move from the August 2024 low. This potential is represented in red "TOP?" on the charts. This is not preferred at this time but I will later revisit conditions for how this potential becomes favored. Within this larger purple count, what's preferred is one more high in this rally from the April low to reach our ultimate target of $125k+. This would further entail that the rally from the April low to the May high was just an (a) wave of circle v and price is currently in the (b) wave pullback. In terms of the retracement, this path is identical to the black count but would deviate upon the next rally; where the subsequent purple (c) wave would reach $125k-$145k as compared to the black count which entails an impending waves circle iii-iv-v targeting north of $200k.
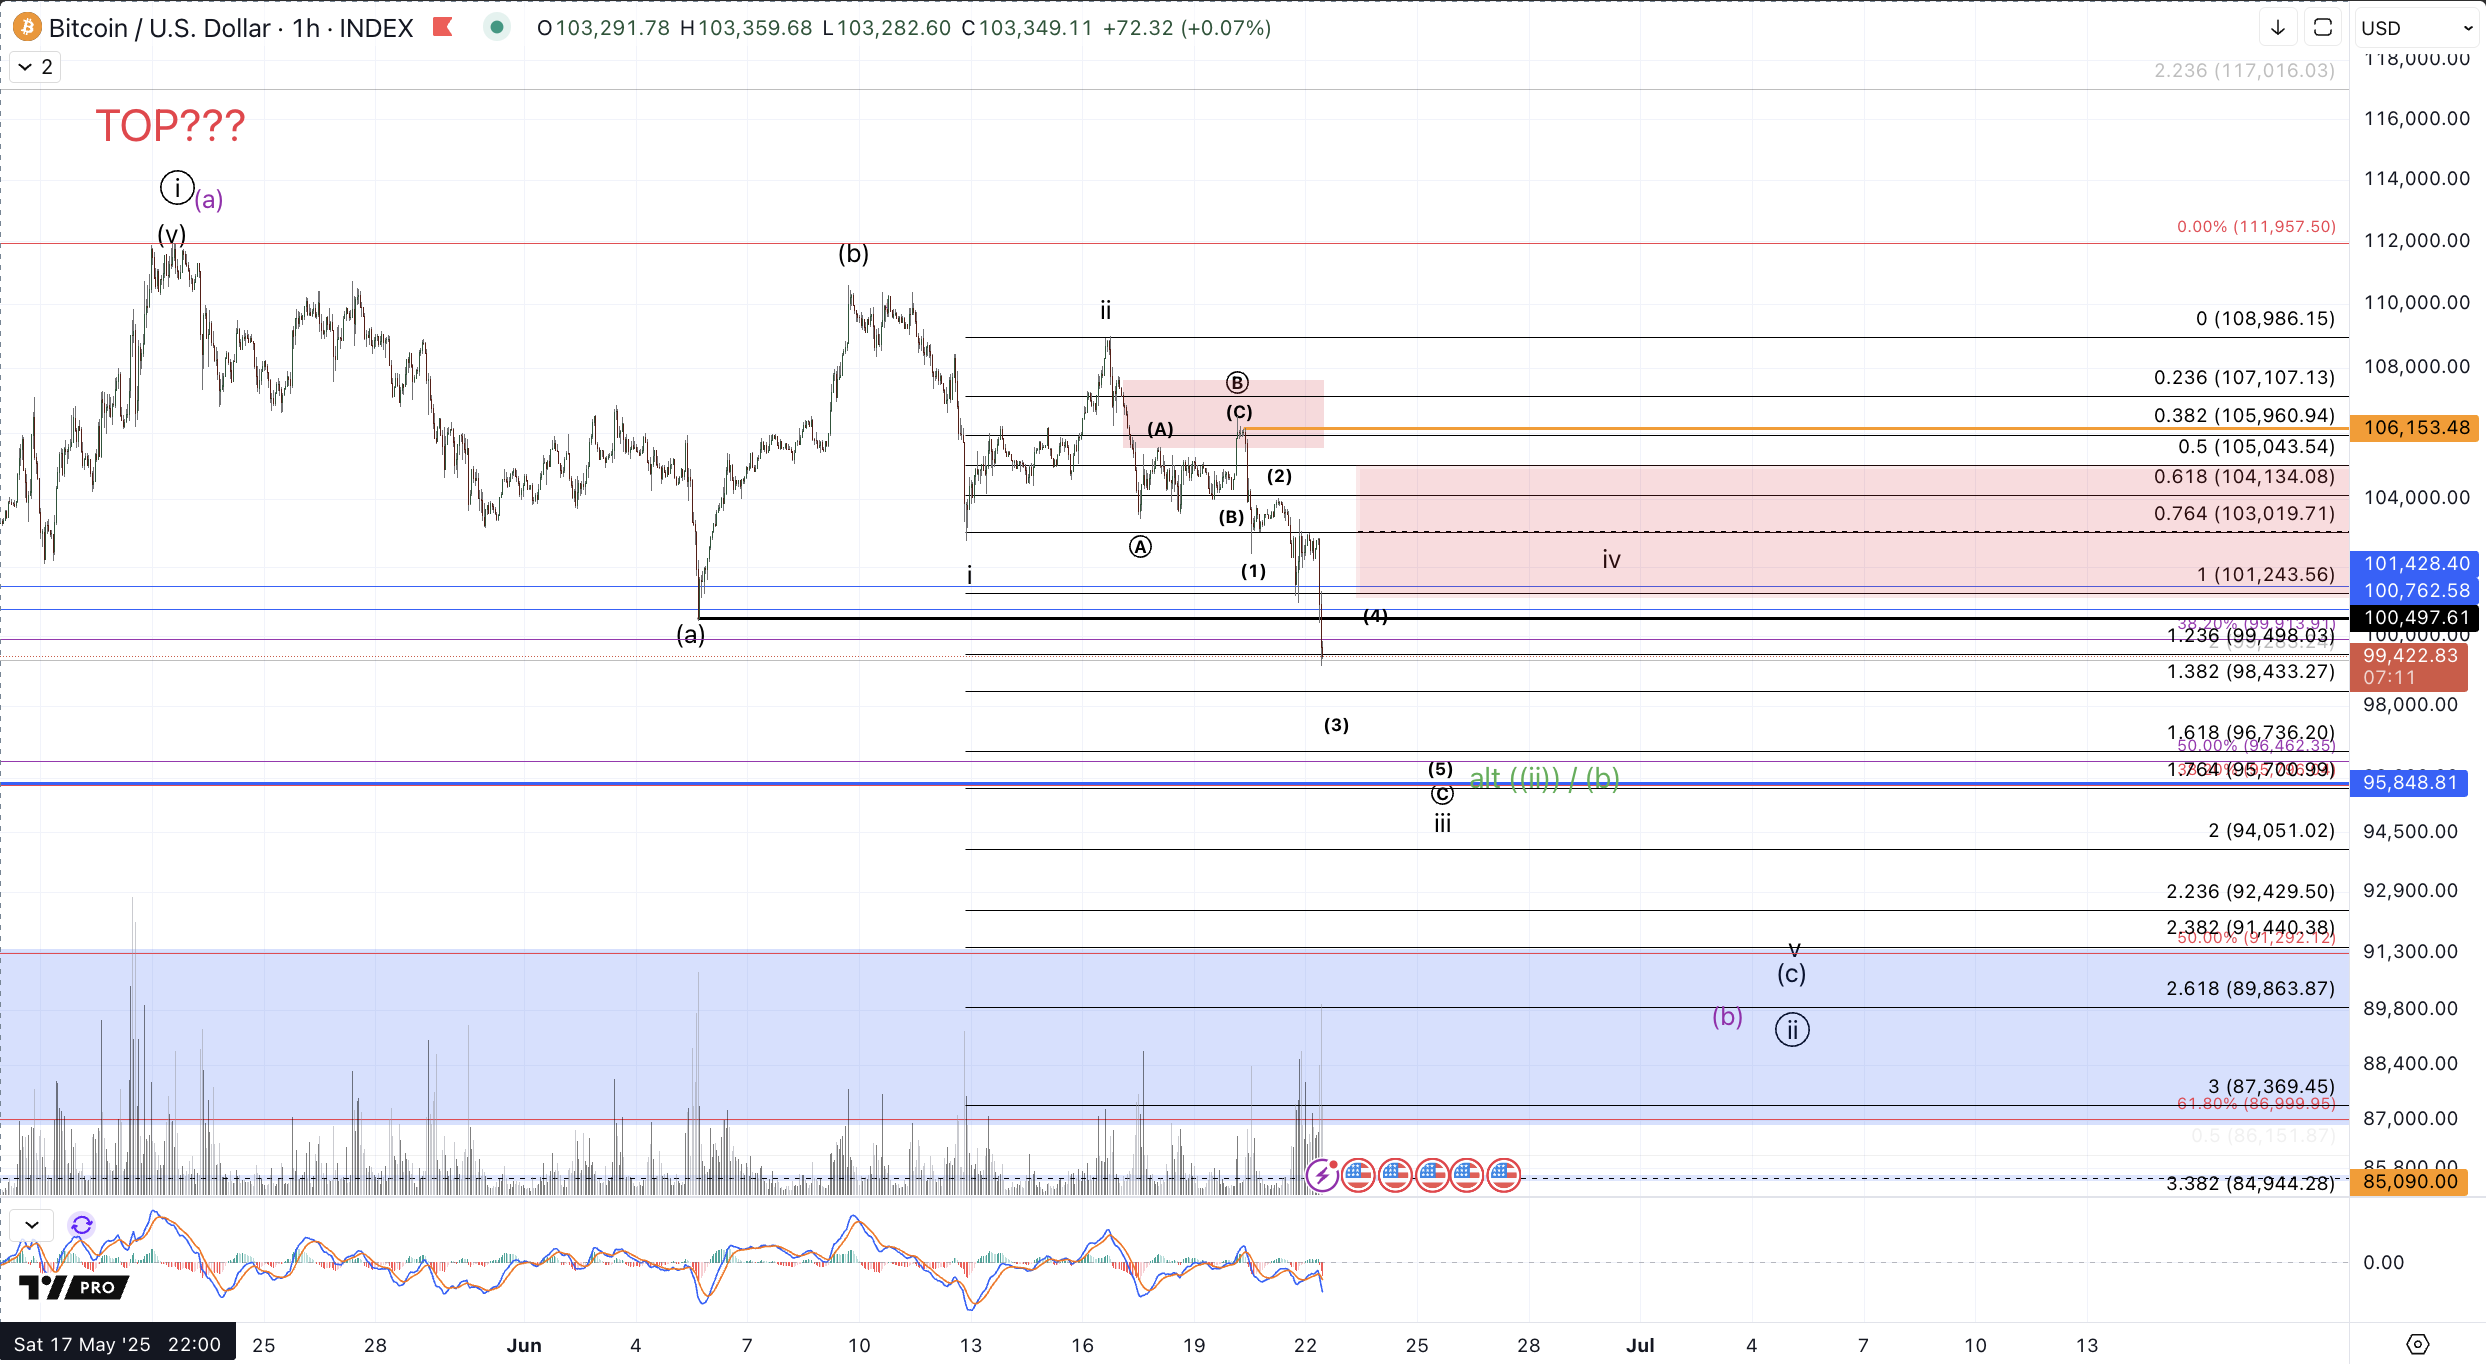
On the micro level price appears to be midway through the wave (c) down which can reasonably extend down to $88k-$91k region. On the lower timeframe, expectations are for a few more squiggles down to complete the wave iii of (c) ideally in the $95.8k-$96.8k region. Resistance in the current stance is $101k-$105k which can ideally be tested after completion of iii in the $96k region. So long as this is respected, expectations will be for a lower low to complete 5 down but alternatively price forming an impulsive rally through $106.2k, would force consideration of a bottom in place. I should also add, that in this news-sensitive environment I would not rule out more spastic gyrations in price which could complete the decline in more accelerated fashion rather than the iii-iv-v suggested on the hourly chart.
As a reminder, while the lower timeframe is still suggestive of downside continuation to complete a pullback from the May high, the medium timeframe expectation is for a bullish resolution to new all-time highs, targeting $125k+. All of that exists within a larger timeframe context in which price should be in the terminal stages of the bullish cycle from the 2022 lows. Please consider the context accordingly in terms of your decisions regarding risk. From last week:
Clearly we'll want to see standard Fibonacci support hold ($87k-$96k) but I would certainly allow for a bit of overthrow before jettisoning the bullish thesis. Bitcoin trading back below the 4/21 low, $85k~, starts to become cause for concern, and concerns increase should price break below $82k (the .764 retrace). Specifically, I'm watching the $81.3k level, which is an untested hourly low in the rally up from early April. So, below $85k is a warning shot of the potential that a much larger degree top might have been struck and below $81.3k signals likely impending invalidation of further bullish continuation up from April.