Apple (AAPL) - Running with the “prophet”/ profit?
Written by Mark Malinowski with charts and commentary from Garrett Patten and Zac Mannes
Be like Warren?
It was also almost a decade ago, in 2016, when Buffet departed from the “avoid” technology stocks advice he gave and started buying Apple shares. Berkshire Hathaway purchased approximately 1 billion USD worth of AAPL to the tune of 9.8 million shares (adjusting for splits). At the time he stated that he saw Apple not as a technology company, but much more like the way he saw Coca-Cola when he bought it: A consumer brand with strong customer loyalty and pricing power.
When he said it, people knew he was right. In North America and Europe, even before Buffet said it, there have been two kinds of people: Android people and Apple people. The price of Apple products have continued to move faster than the rate of inflation. Small incremental improvements in the technology have translated to continued increases in the premium price of that technology, be it phones, tablets or personal computers. Everything from packaging, to product finishing, to user interface have continued to make Apple the “Rolex of the consumer electronics industry.”
Over the last two years, Berkshire has increasingly looked at Apple as an overvalued company and yet, in that time Apple has increased in value almost 50%. So, despite the significant sale of shares, it remains the top holding of Berkshire as of the end of Q3 2025 (approximately 21% of their stock portfolio).
So according to some estimates Berkshire has 9x their investment from 2016 and are still holding. But the question remains, should you?
Fundamentals
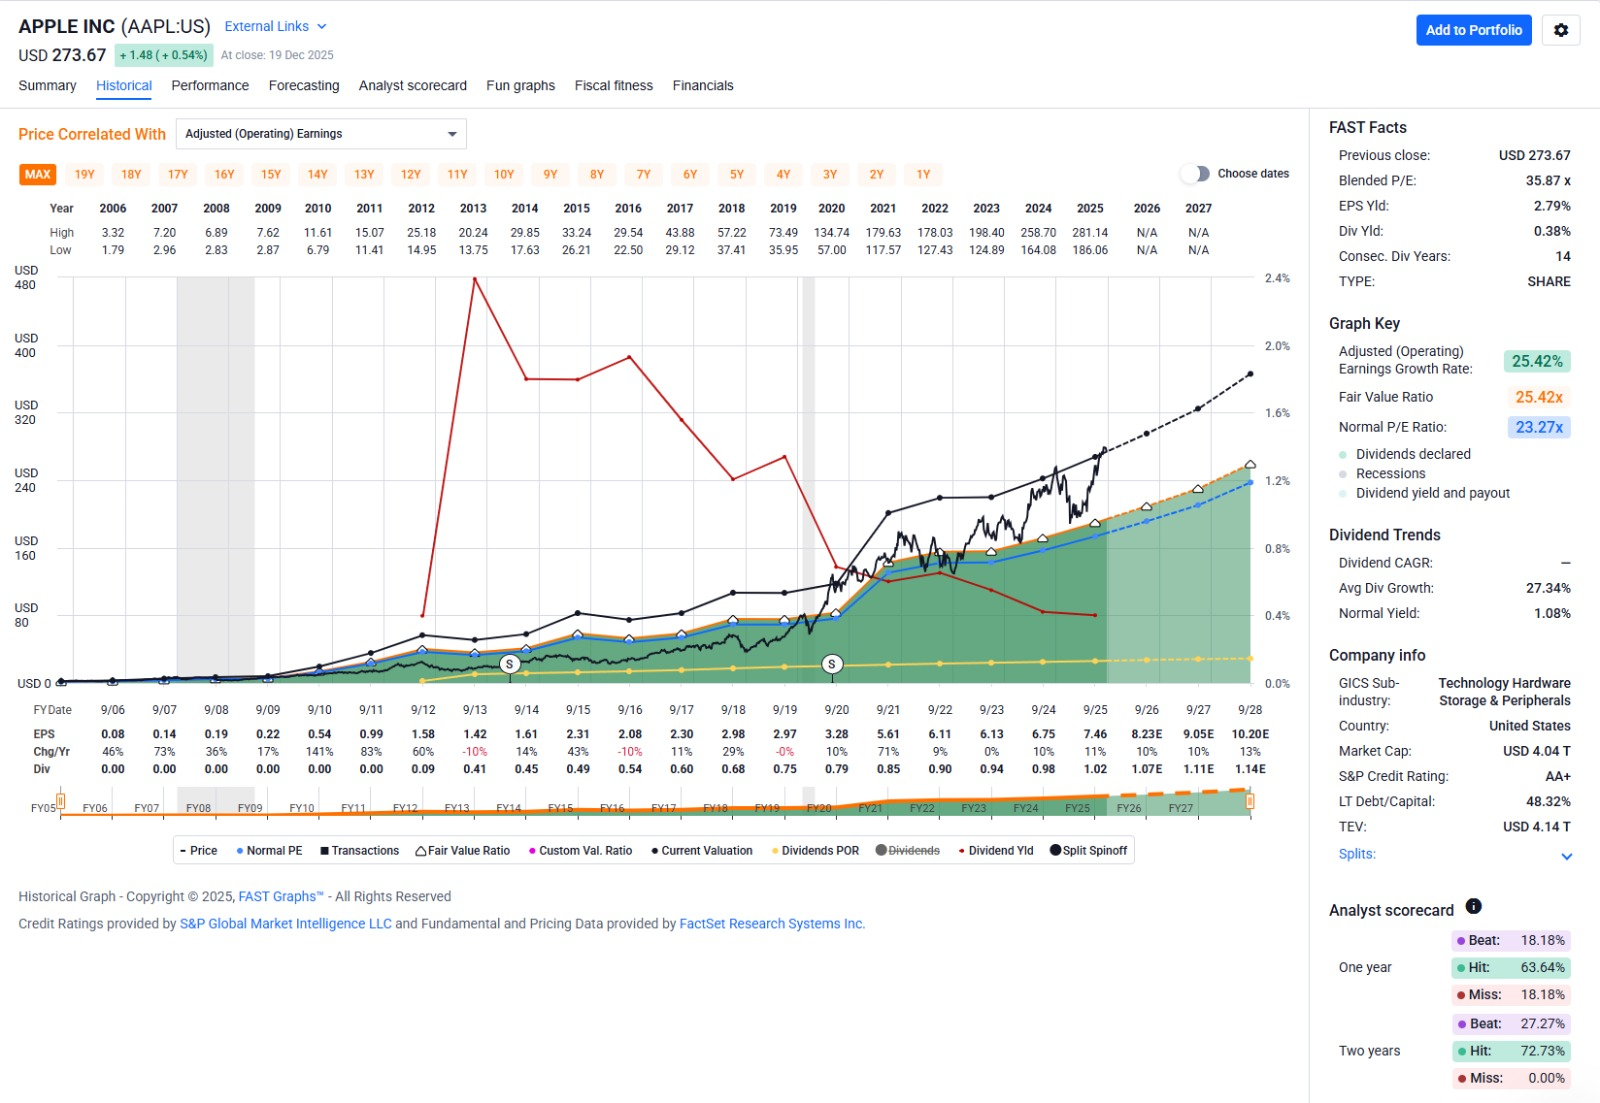
According to the Adjusted Earnings Graph, Apple has been trading well above its fair value since late 2022 for the vast majority of the time. The effect of US import tariffs has certainly put more pressure on profit margins at Apple but based on their forecasting this is expected to all be picked up by the end consumer. Costs have to be ramping up with the relocation of factories from China to other South East Asia countries, increased labor costs and general increases in the cost of raw materials and chip production.
Yet, the company continues to forecast growth at a steady pace over the next several years. So if the fundamentals continue to support some steady growth, maybe the technicals also support that approach as well.
Elliott Wave Theory Lens
Looking at AAPL through an Elliott Wave Theory “Lens” analysts use Fibonacci ratios and Elliott Wave Theory counts to find high probability setups. While we have tracked AAPL since the service began in 2012, Stock Waves regularly updates its count, support and resistance levels.
As noted many times in bull markets, extension beget more extensions has applied to all manner of charts, be it the silver chart most recently, the bitcoin chart or the index charts.
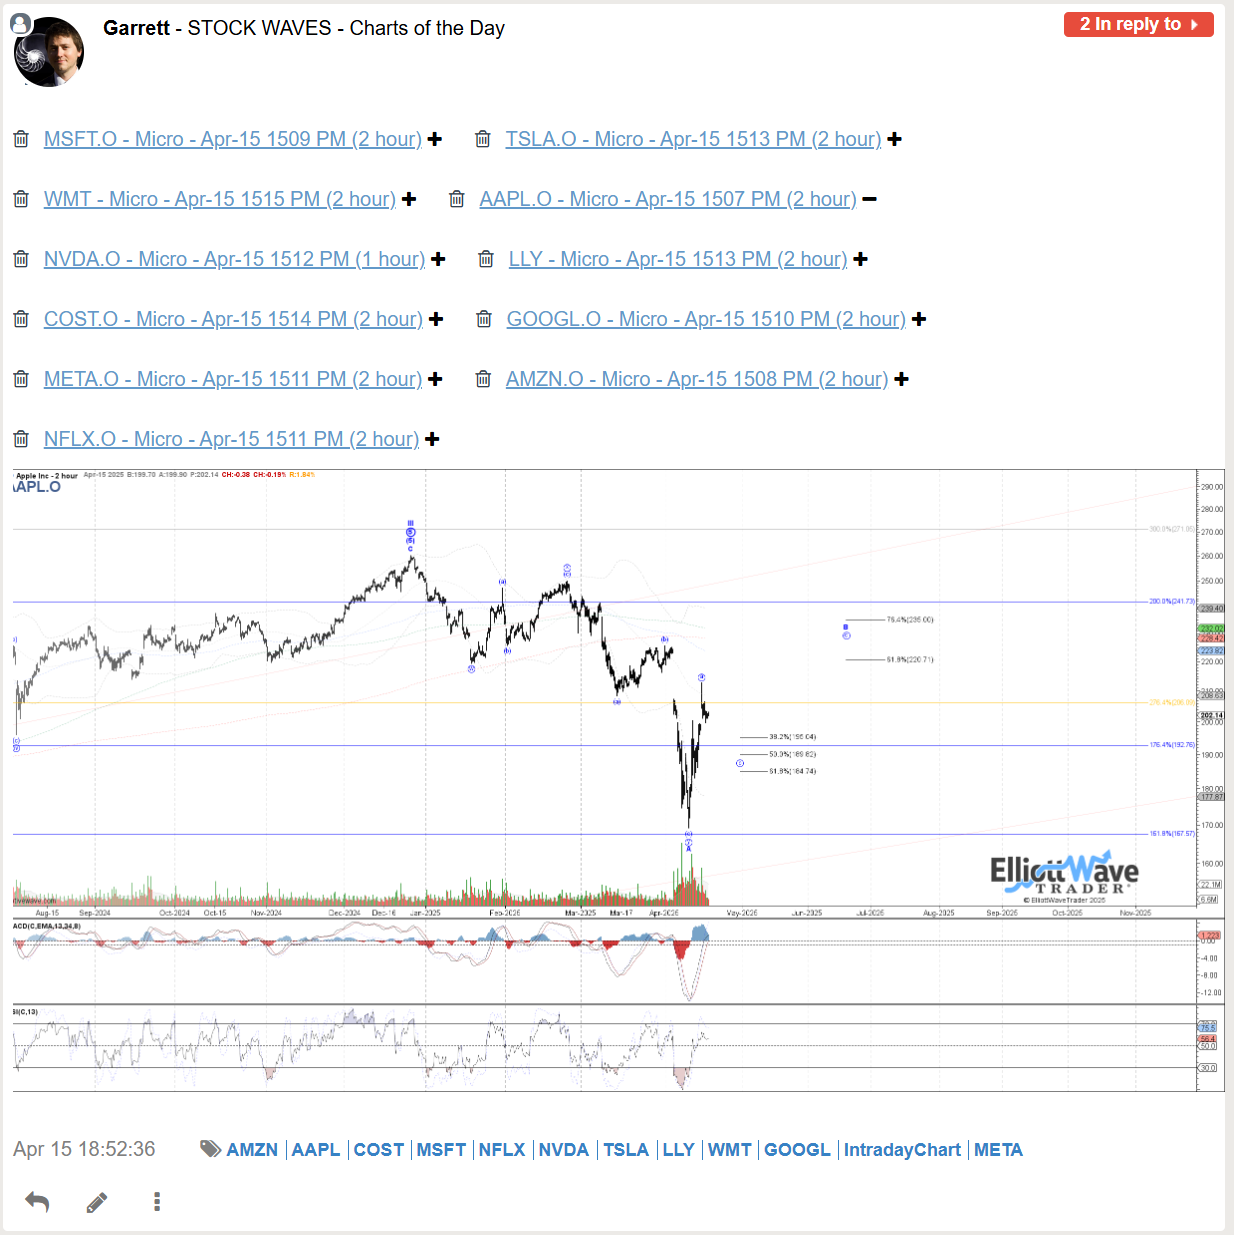
The bullish journey for AAPL in 2025 was highlighted back in April in multiple Stock Waves videos with many charts receiving Wave Setups, but initially looking for a large degree B at the time, but with the potential to head to new highs for a larger wave III. Garrett only showed his primary count in this chart capture, but like many tech charts in the video was open to it being more than a bounce.
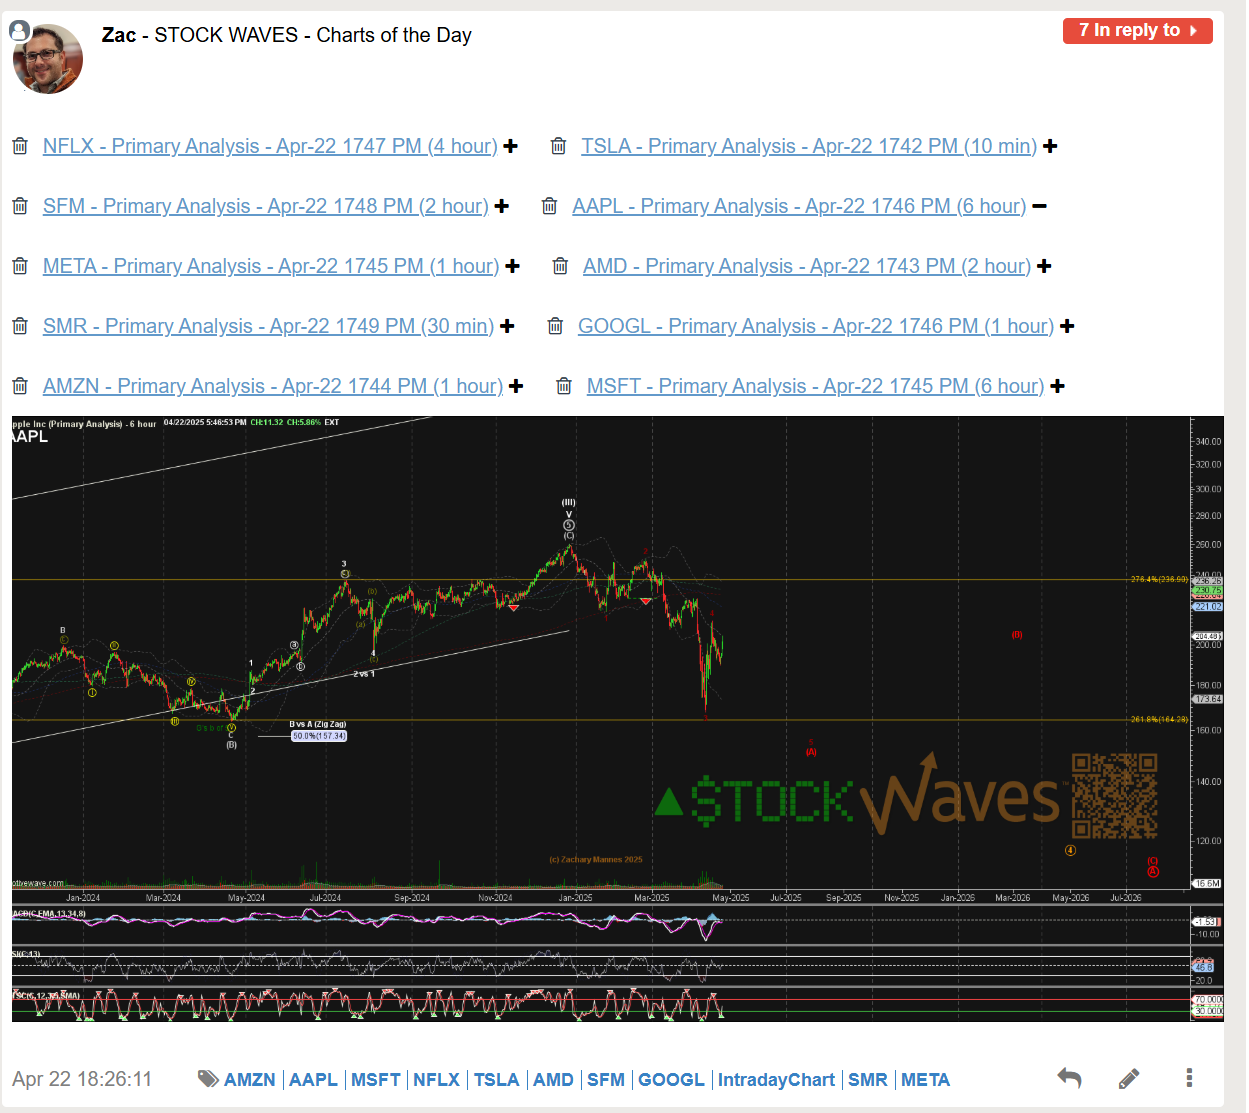
A week later Zac Mannes discussed the potential for the April low to be all of wave P 4 in orange but so far the pullback was quite shallow and there was yet to be seen a clear pullback to improve the risk reward potential for a move higher or lower.
Two months later and stock had continued to grind sideways, meaning any capital deployed had been stagnant and better deployed elsewhere, up to that point in time. However, Garrett’s chart noted that ideal support for circle b was near.
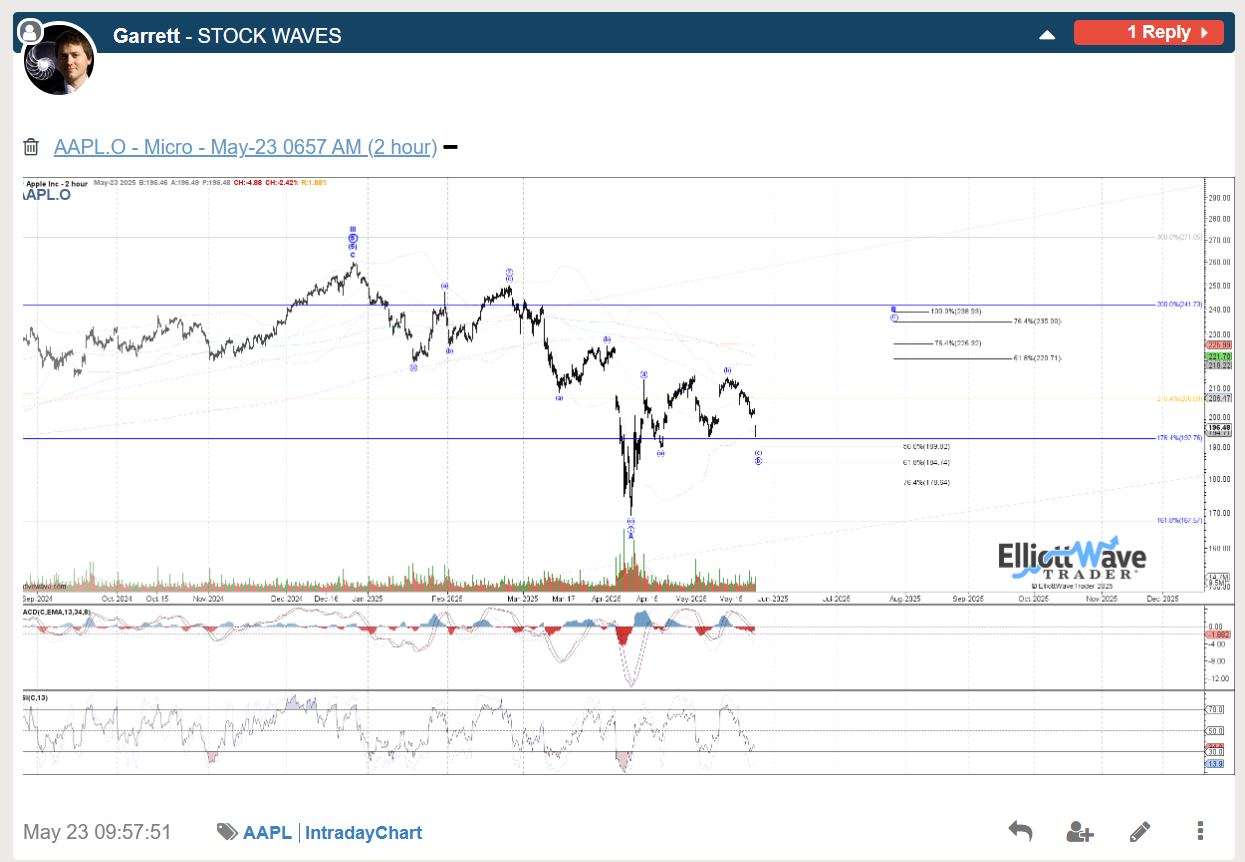
Price has in fact not been any lower in 2025 since that point premarket on May 23rd, however it did continue to consolidate sideways more in time for the next month.
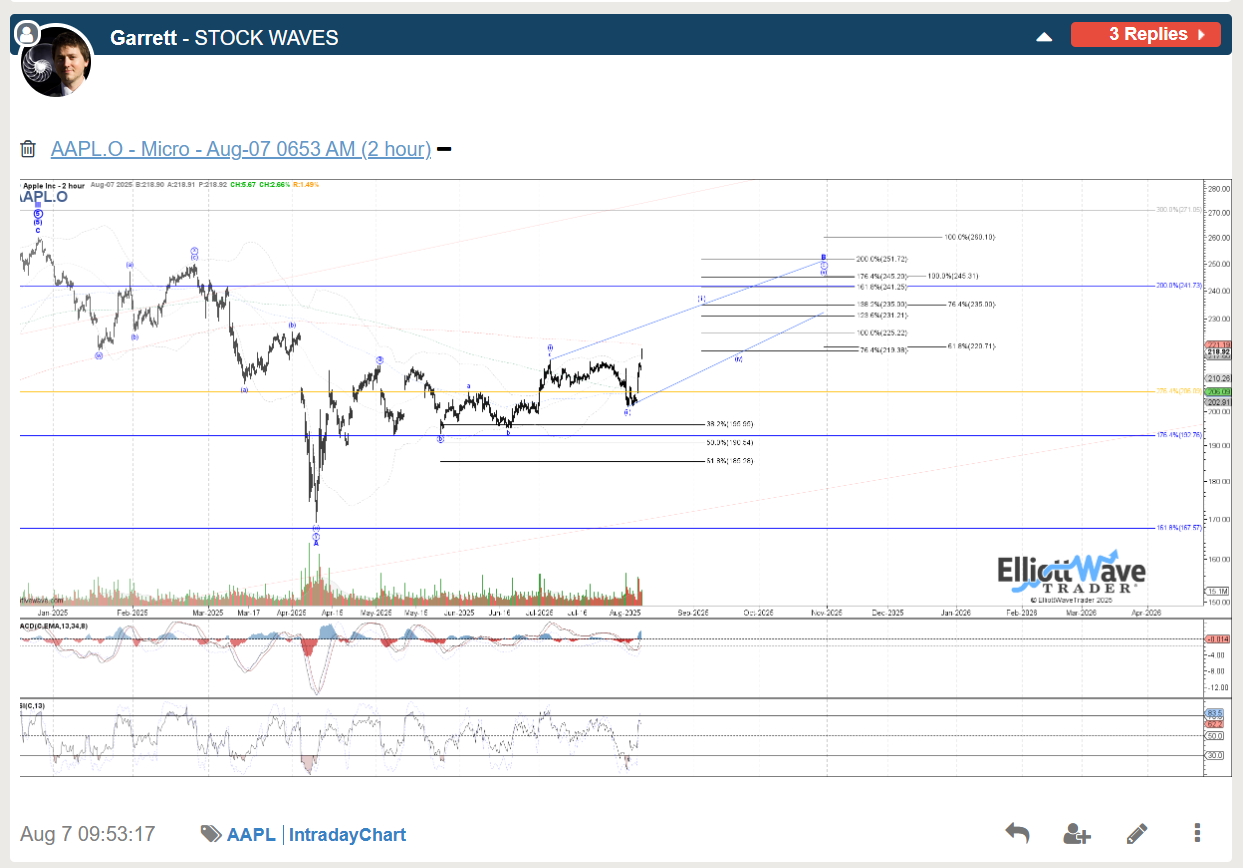
The price pattern has continued to extend, like the SPX itself with very little in the way of good entry points since late May for AAPL, with price hitting measured move resistance in early August. However by August 7th Garrett noted the structure was pointing to more of an extended upside potential for a larger circle c of B.
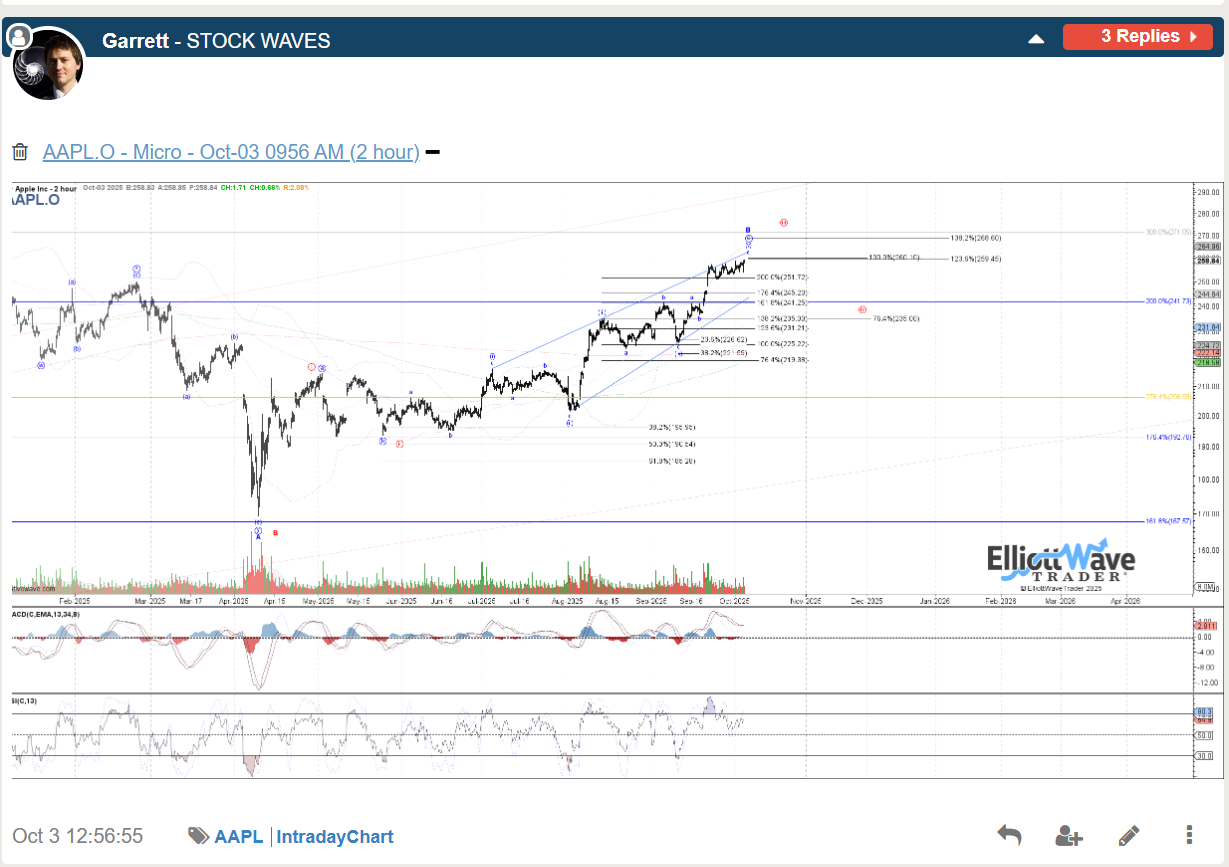
By early October AAPL had continued to stair step higher into resistance but if wave C in blue was about to begin there needed to be a clear 5 wave decline to signal that start as C waves are always 5 wave structures, but can have 3 wave substructures, making price even more important than structure heading into a potential 4th wave or C wave start.
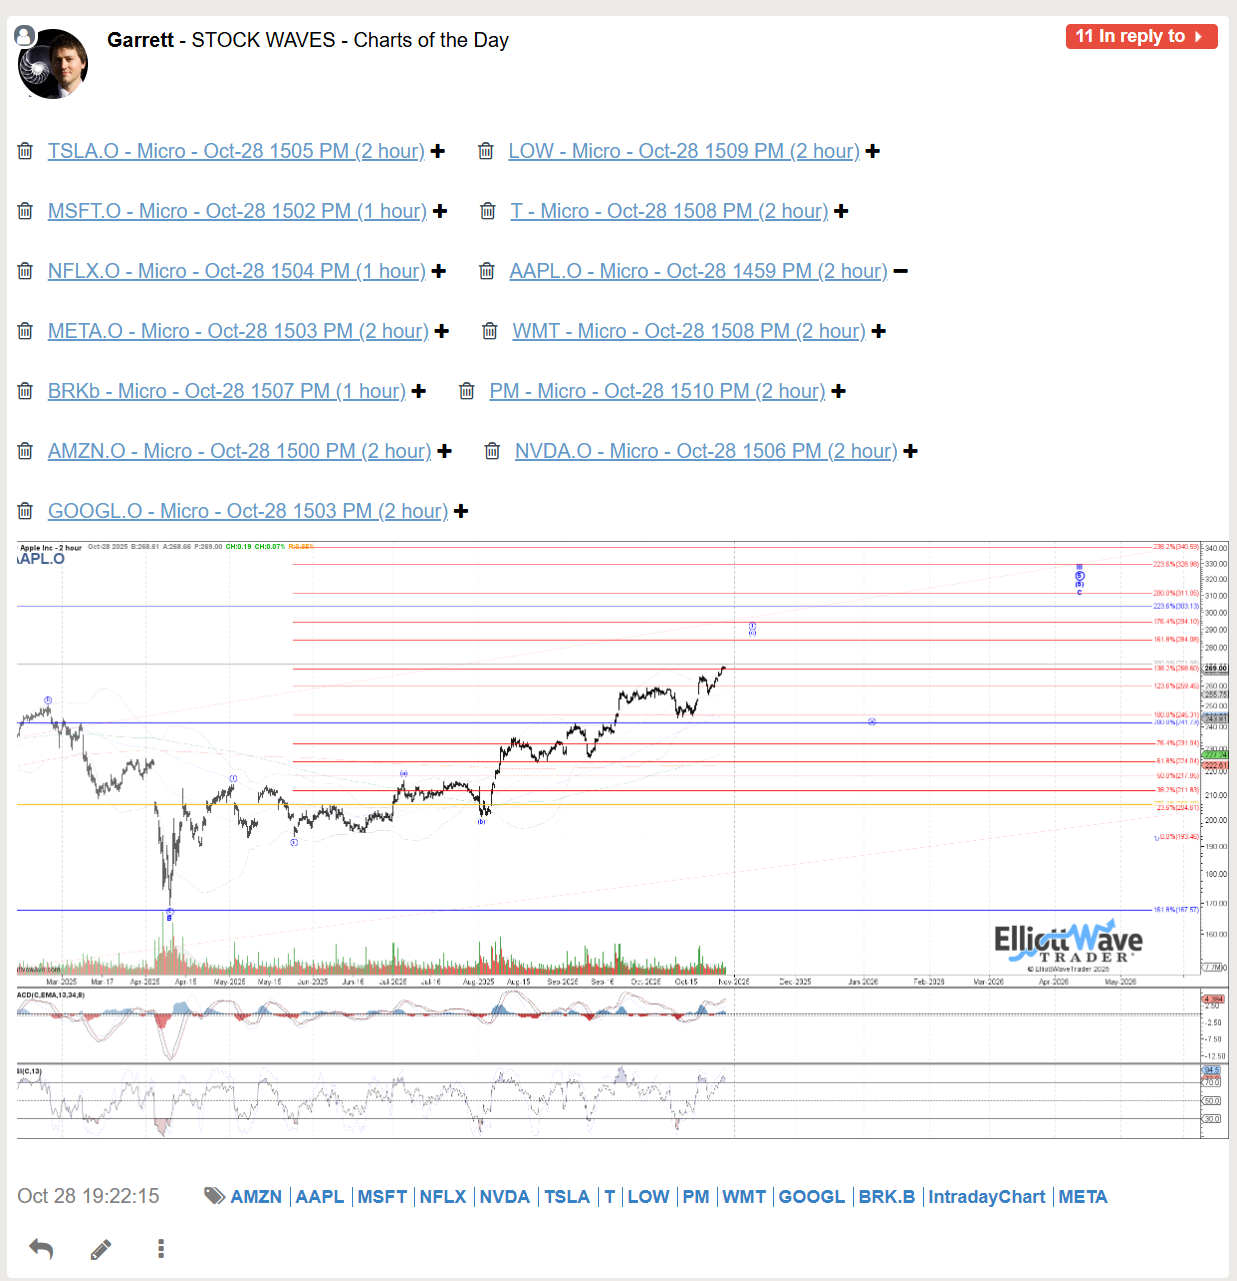
Price again continued to extend higher, leading Garrett to make the more bullish red count his primary by the end of October.
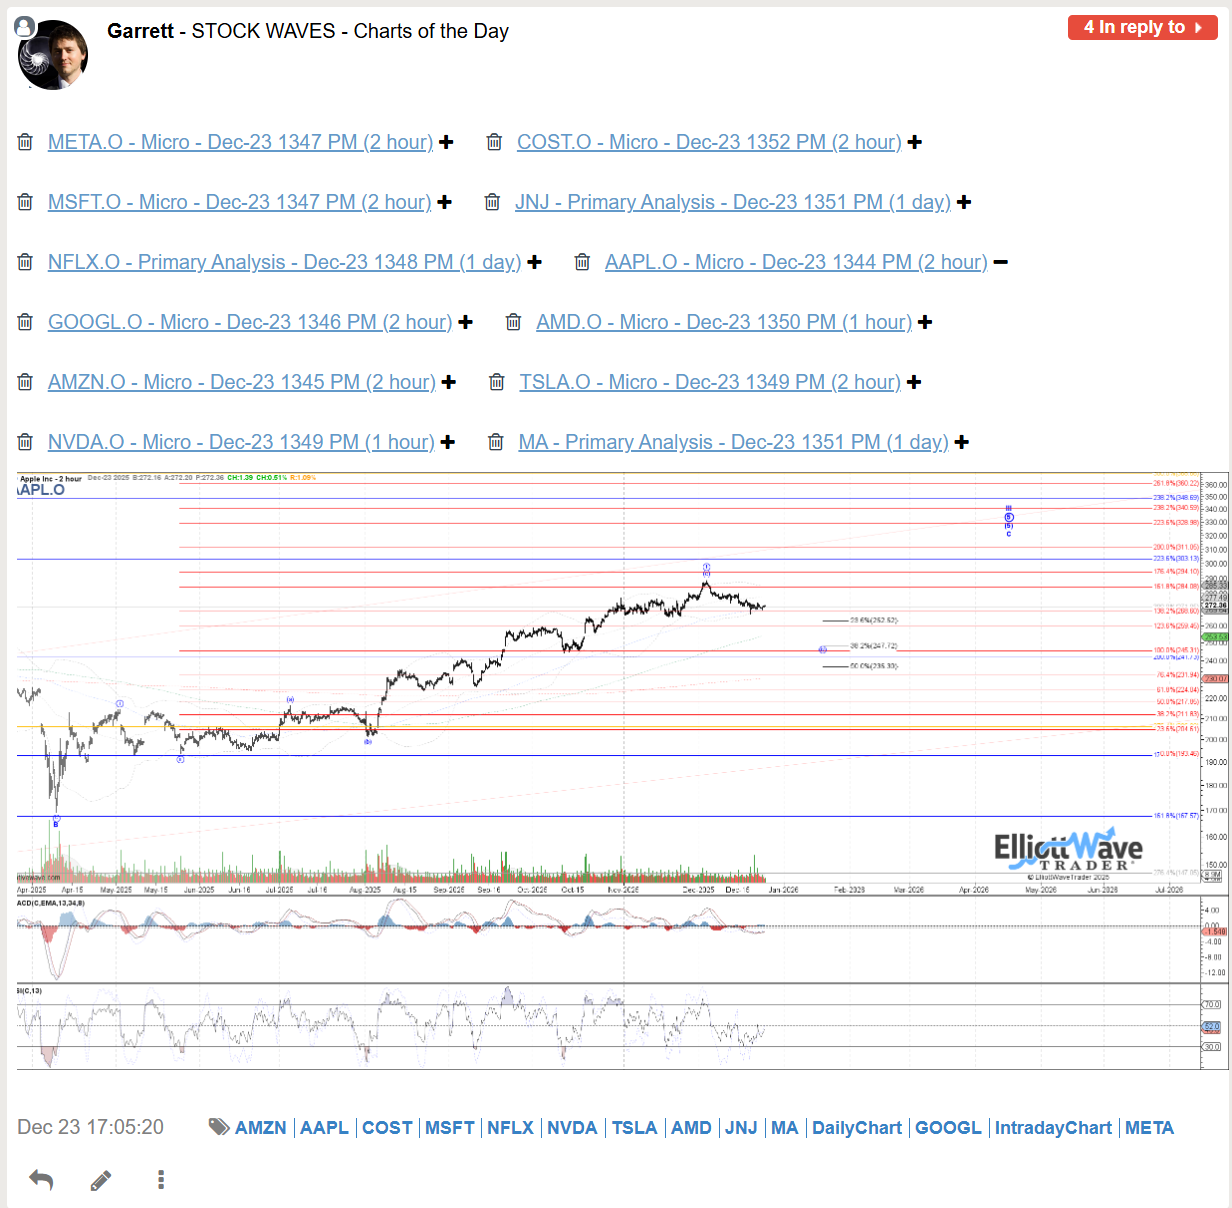
On December 2nd Zac Mannes shared the following observation from his AAPL chart which was potential that there was a wave 3 top in place (Zac is counting this as one degree higher than Garrett, but the targets and structure in the months perspective is the same)
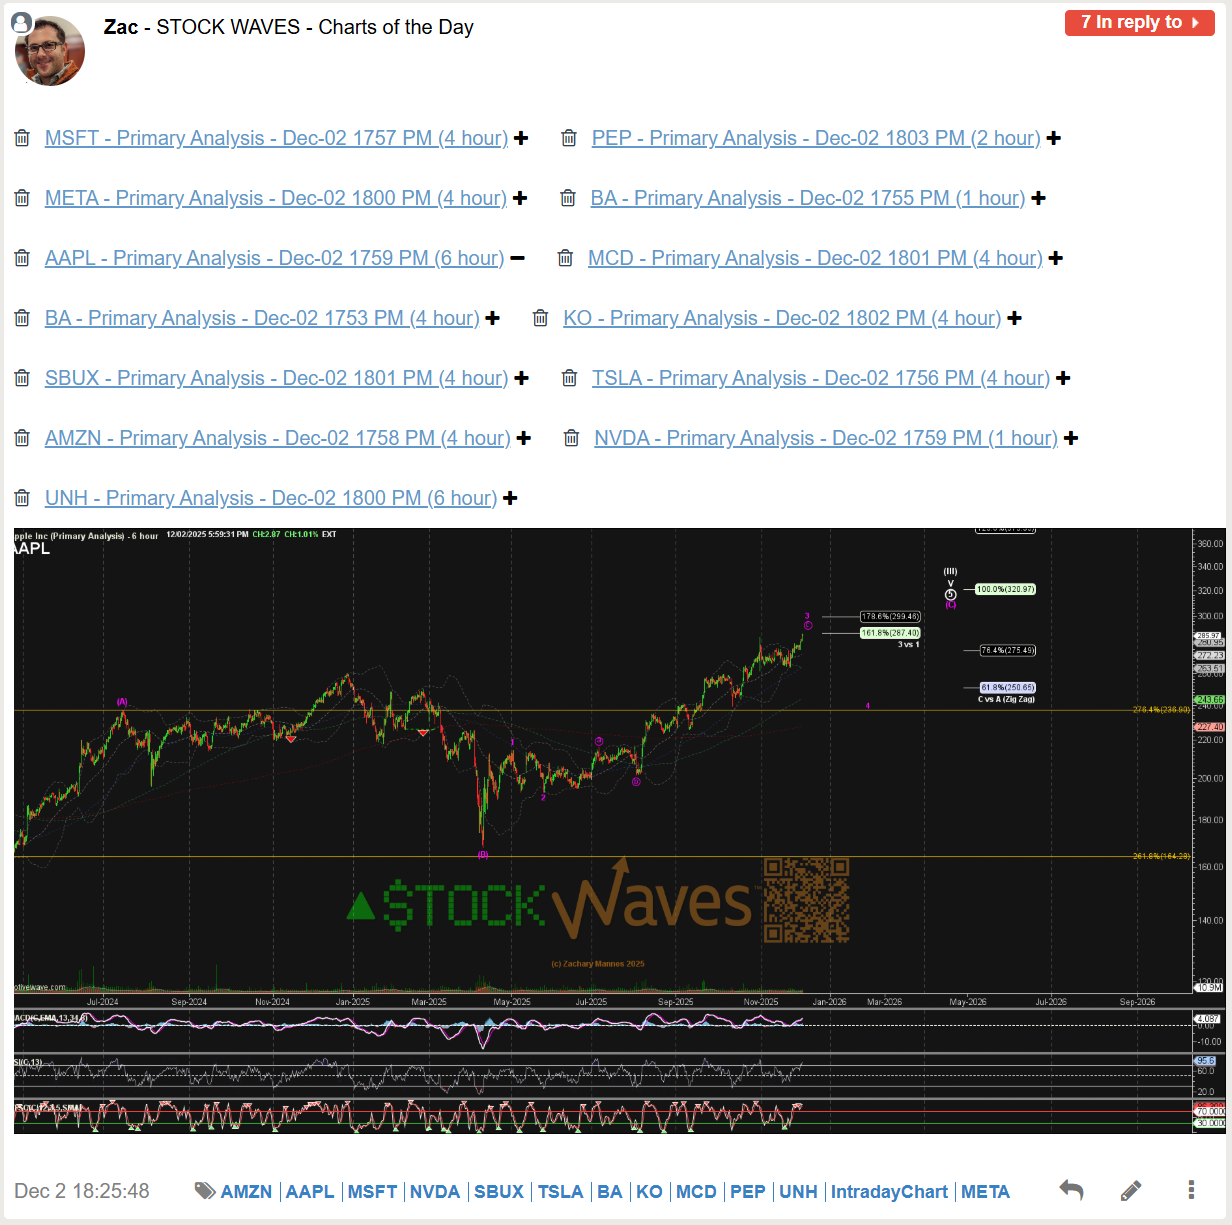
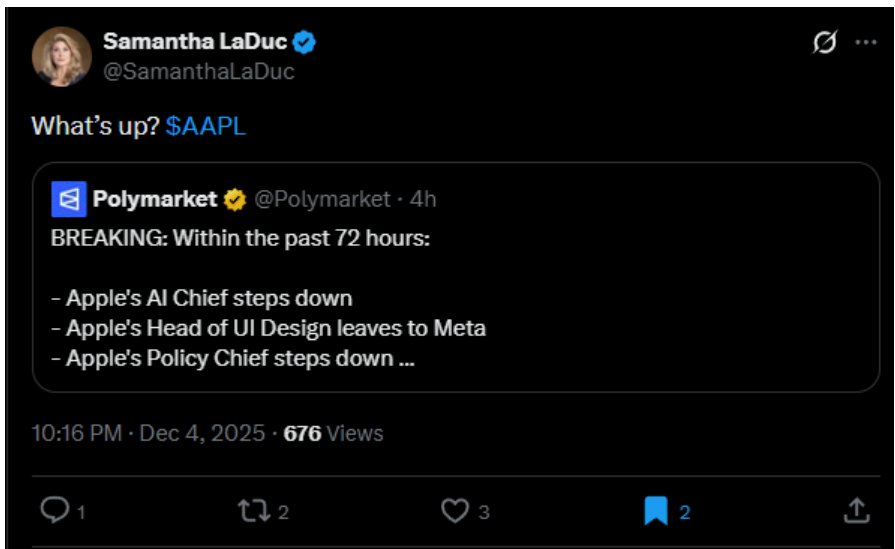
Zac also noted the news that people in leadership at AAPL had been leaving the company over the last several days:
Since early December price has continued to meander sideways and down towards Garrett and Zac’s targets, but both are still ideally looking for more upside once this consolidation is complete.
Risk Management
While Zac would like to see price hold for wave 4 (circle iv on Garrett’s chart) and push higher, he recently stressed the importance of holding the low 230s plus to give this the best chance of attempting higher in wave 5.
We also think that it is important to highlight the risk skew for higher. What do you mean by risk skew? Well in the bigger picture this is approaching a very major top for wave super cycle (III) (or cycle III.) Meaning the potential for a prolonged pullback as wave (IV) (or IV) is not that far away. So while upside to the low 300 price level is reasonable if price can hold the 230s region. In the bigger picture the $80 potential upside should also be compared with the cycle wave pullback downside potential which could easily point to double digit territory. (ie $XX per share). So depending on your timeframe for trading or investment, this information may change how, when and in what size one might consider trading for higher.
Separation of Price and Structure from Emotion
So while some charts move straight lines, most meander up and down to hit targets and support. Apple, like the market, has continued to surprise some to the upside. We play charts one step at a time, allowing opportunities to identify support and targets. Especially when it comes to diagonal structures like AAPL, it is important to understand how much movement there can be in price and yet maintain a healthy looking structure. However, it is also important to be aware of when there is an opportunity to reduce risk and take profit from a position.
Relying only on price and structure (not news or emotions) allows one to make logical decisions, not be FOMO’d into buying a top or be frightened out of a position when price drops.
Our highest probability setups receive Wave Setups based on the clearest and “cleanest” charts and Elliott Wave Structures, we identify support, resistance and invalidation prices.
If you appreciate a one step at a time approach that can take the emotion off the table, come check us out at Stock Waves at ElliottWavetrader.net where we cover all manner of individual stocks from Apple to Zebra.
