Another Pullback in the Bigger Uptrend
 By
By
Price action is bearish short term, neutral/bullish medium term and bullish long term.
After hitting the 5250 area in Thursday on the Emini S&P 500, we seem to be having some significant supply come into the market and we are now trying to find support at lower levels. So far, nothing is broken in the bigger uptrend and this looks like it could be another pullback in the context of that.
If this is indeed just a pullback, we should start to see some buying support show up very soon, and getting above 5202 on ES would be a good initial sign that bottom is in.
Internals are ok but on the weaker side on the short term. Longer-term internals continue to look good. I am looking for market to find some kind of temp bottom very soon and move higher into mid week. If that ends up being a lower high, then we might have some more bearish on our hands for the medium term, but for now, bulls are still in control on the intermediate term timeframe.
Pivots/Zones -
ES Grey Zone areas - The grey zones on the ES 5 min chart below are what I draw in on a discretionary basis - they are supports and resistance areas which the market is most likely to react from. If we test a zone from below, it is likely to be rejected and fall lower to test support zones below. If we test a zone from above, it is likely to take support there and begin a move higher. So these zones can be used for intraday trading and/or as entry points for positioning for swing trades. These zones are drawn in based on what the market has done there previously both on smaller and larger timeframes.
Grey zone resistance at 5188/5202 and 5240-53. Support is at 5168-57 and 5130-21..
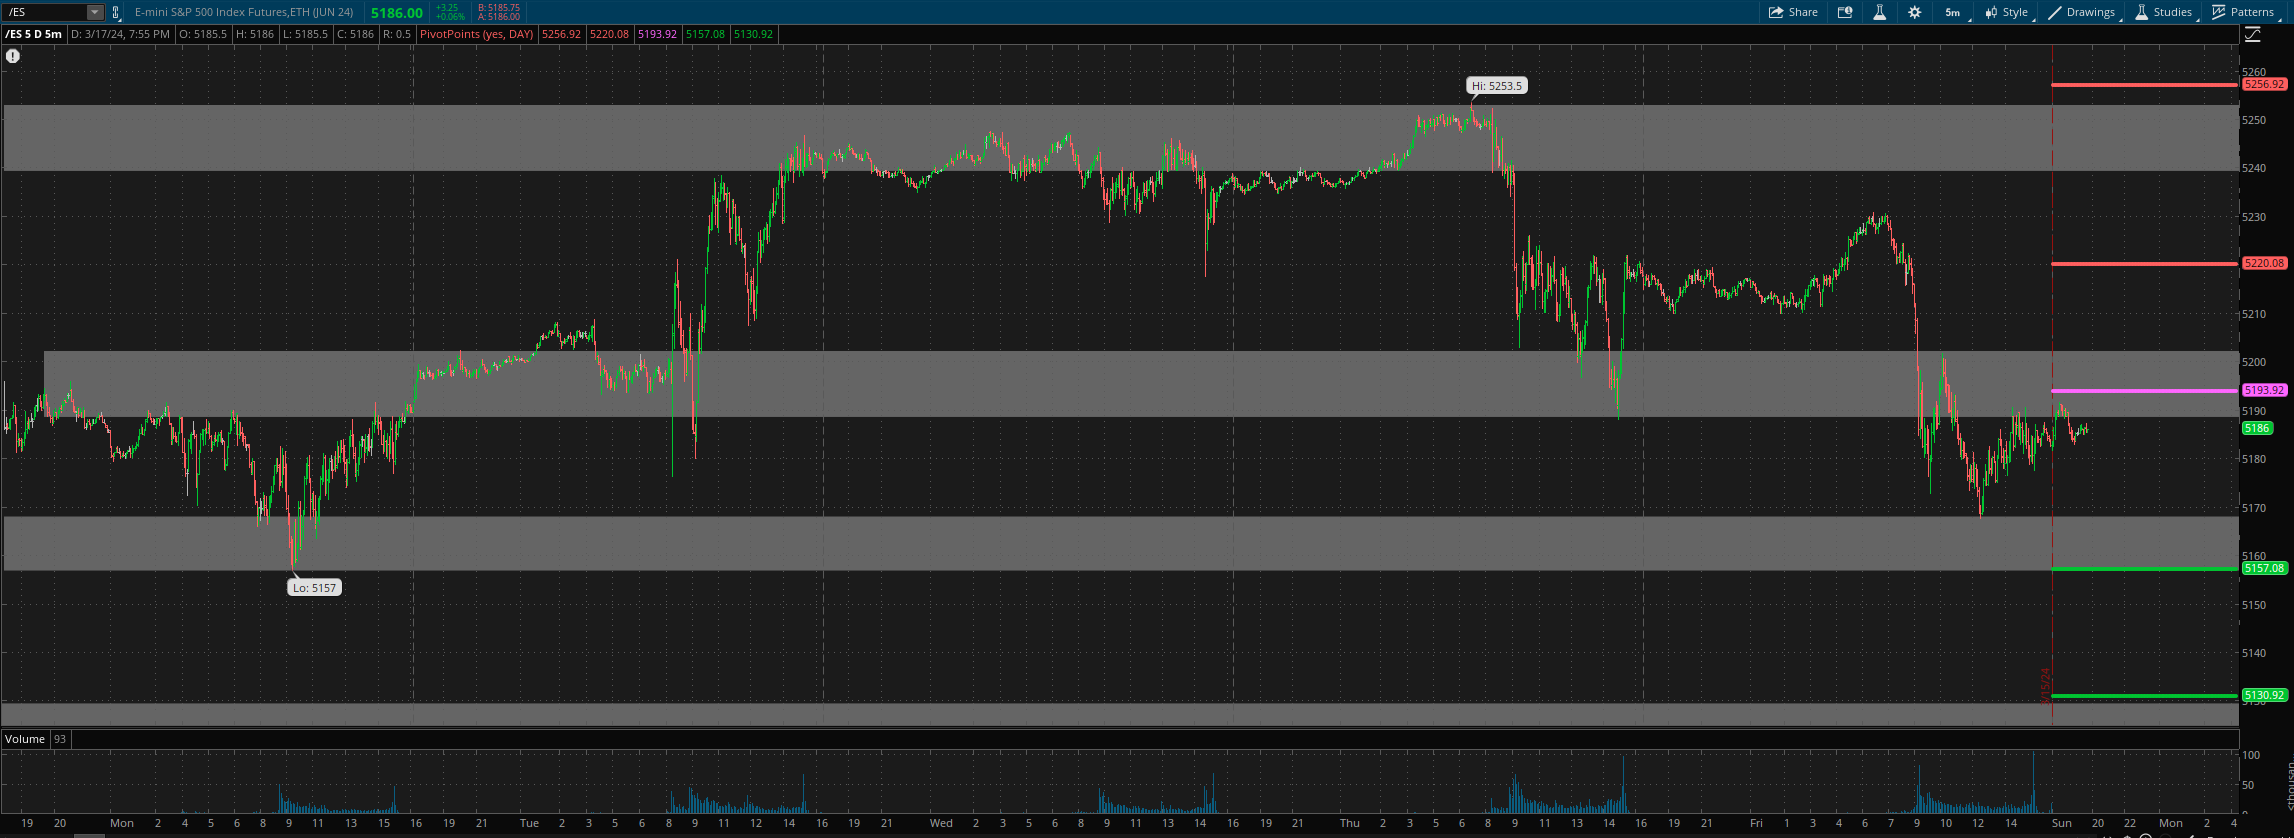
For today, daily pivot is at 5194. Resistance R1 is at 5220 and R2 at 5257. Support S1 is at 5157 and S2 at 5131.
All the best to your trading week ahead.
