Amgen (AMGN) - A Healthy Diagonal Chart
Written by Mark Malinowski with charts and commentary from Lyn Alden, Zac Mannes and Garrett Patten
The negative press surrounding the “over-the-counter opioid” crisis has faded enough for Netflix to make a movie about it. Meanwhile, pharmacy companies have continued to look for and produce solutions to treat the ongoing epidemic of cancer that best estimates suggest will affect 40% of the US population in their lifetime. Issues surrounding chronic inflammation including autoimmune, degenerative diseases, diabetes and cardiovascular disease can be linked to approximately 60% of all global deaths.
That is a VERY large target market. Amgen is one of many companies that continues to produce and look for solutions.
Lyn Alden had this to say about AMGN to our members:
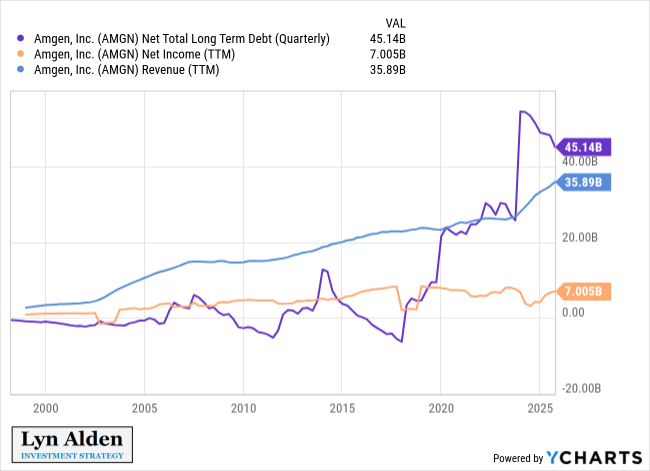
Amgen's organic growth is sluggish, but with a combination of large acquisitions to generate top-line growth, as well as share buybacks to fuel per-share growth, they've managed to generate decent shareholder returns.
Overall, I continue to be long AMGN, though with only moderate conviction. They've added substantial debt in recent years, and I would like to see a period of mild deleveraging and consolidation.
Amgen has been tracked by the Stock Waves service at Elliott Wave Trader (elliottwavetrader.net) for many years but earlier this year we identified a Wave Setup for our subscribers. Wave Setups set clear parameters for support, resistance and when a setup has been invalidated based on the Elliott Wave structure.
AMGN was covered in an end of day video by Garrett Patten identifying a potential bottom back on April 14th, but this was not made into a Wave setup at that time as Garrett identified that there was no clear move up to confirm a start to wave circle c of A.
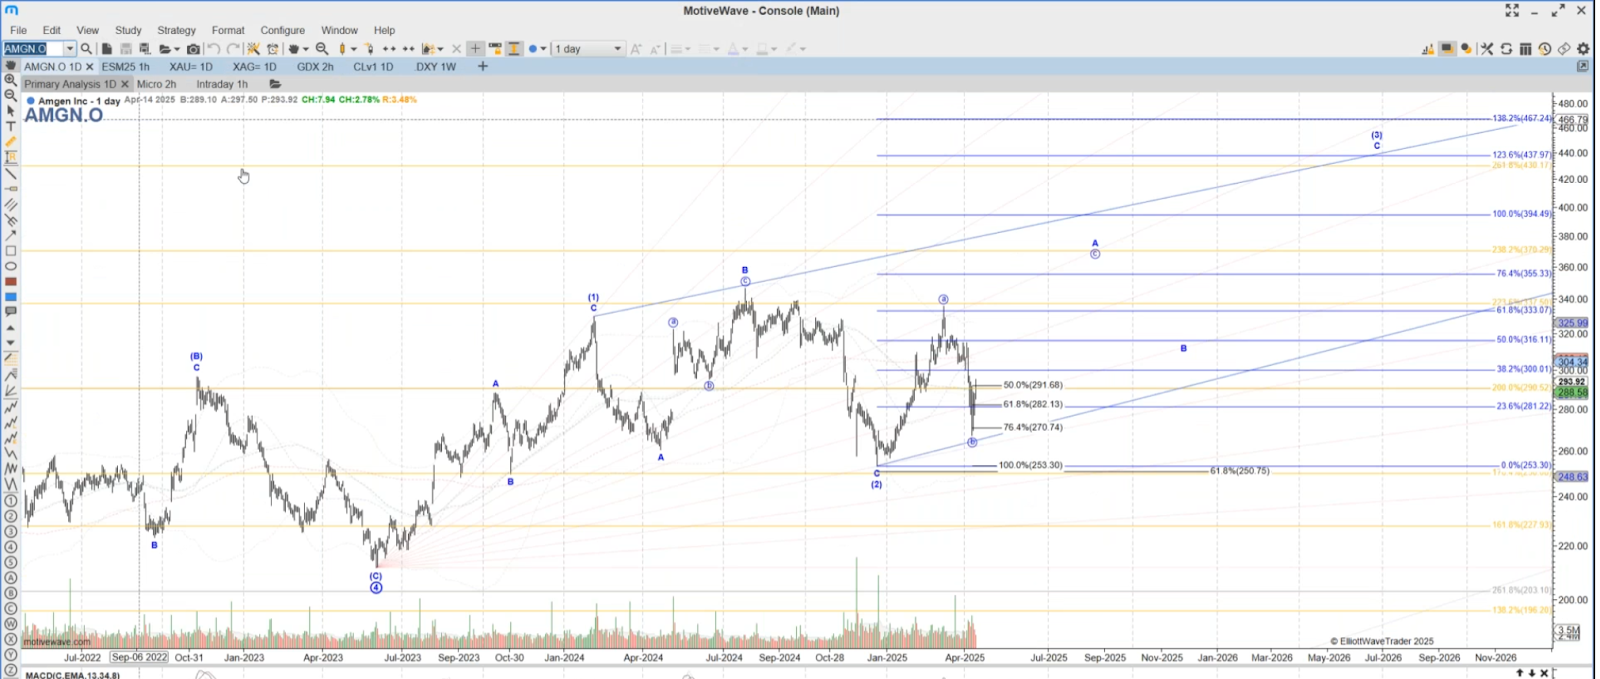
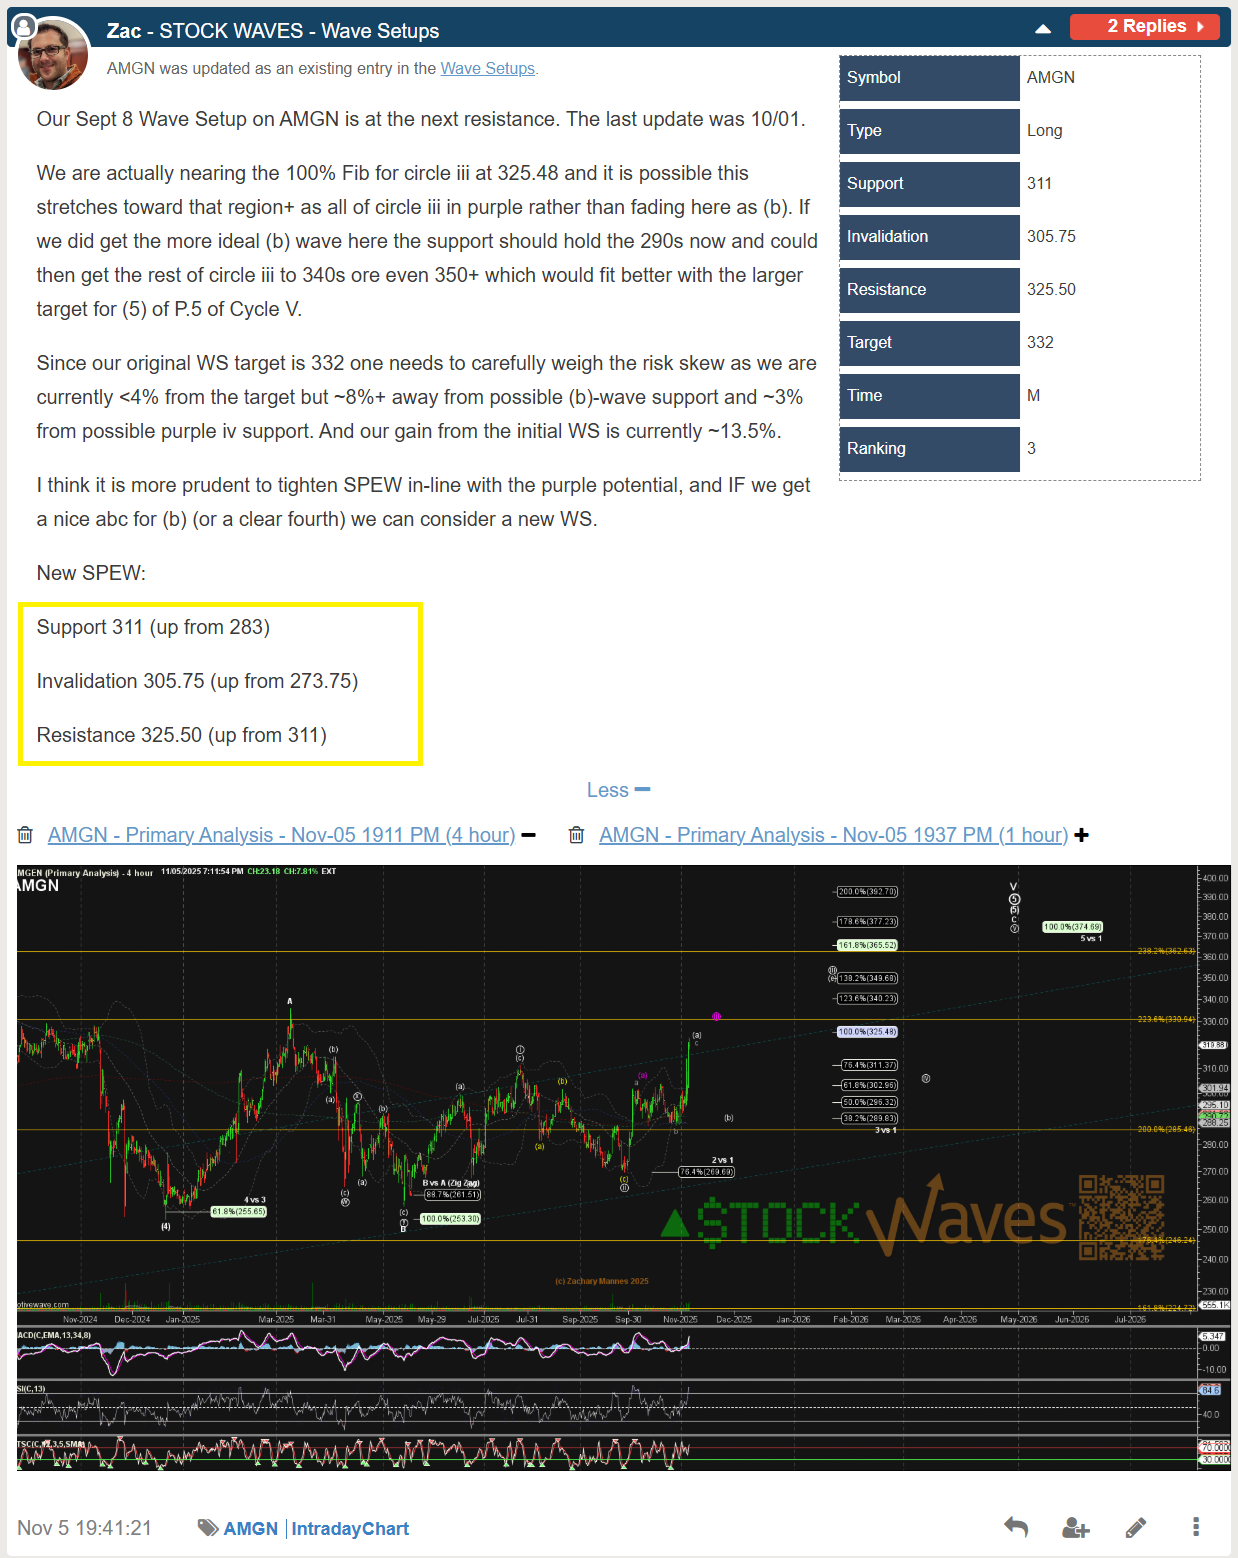
The pattern progressed deeper before displaying a clear 5 waves up and 3 down into early September low when a Wave Setup was presented.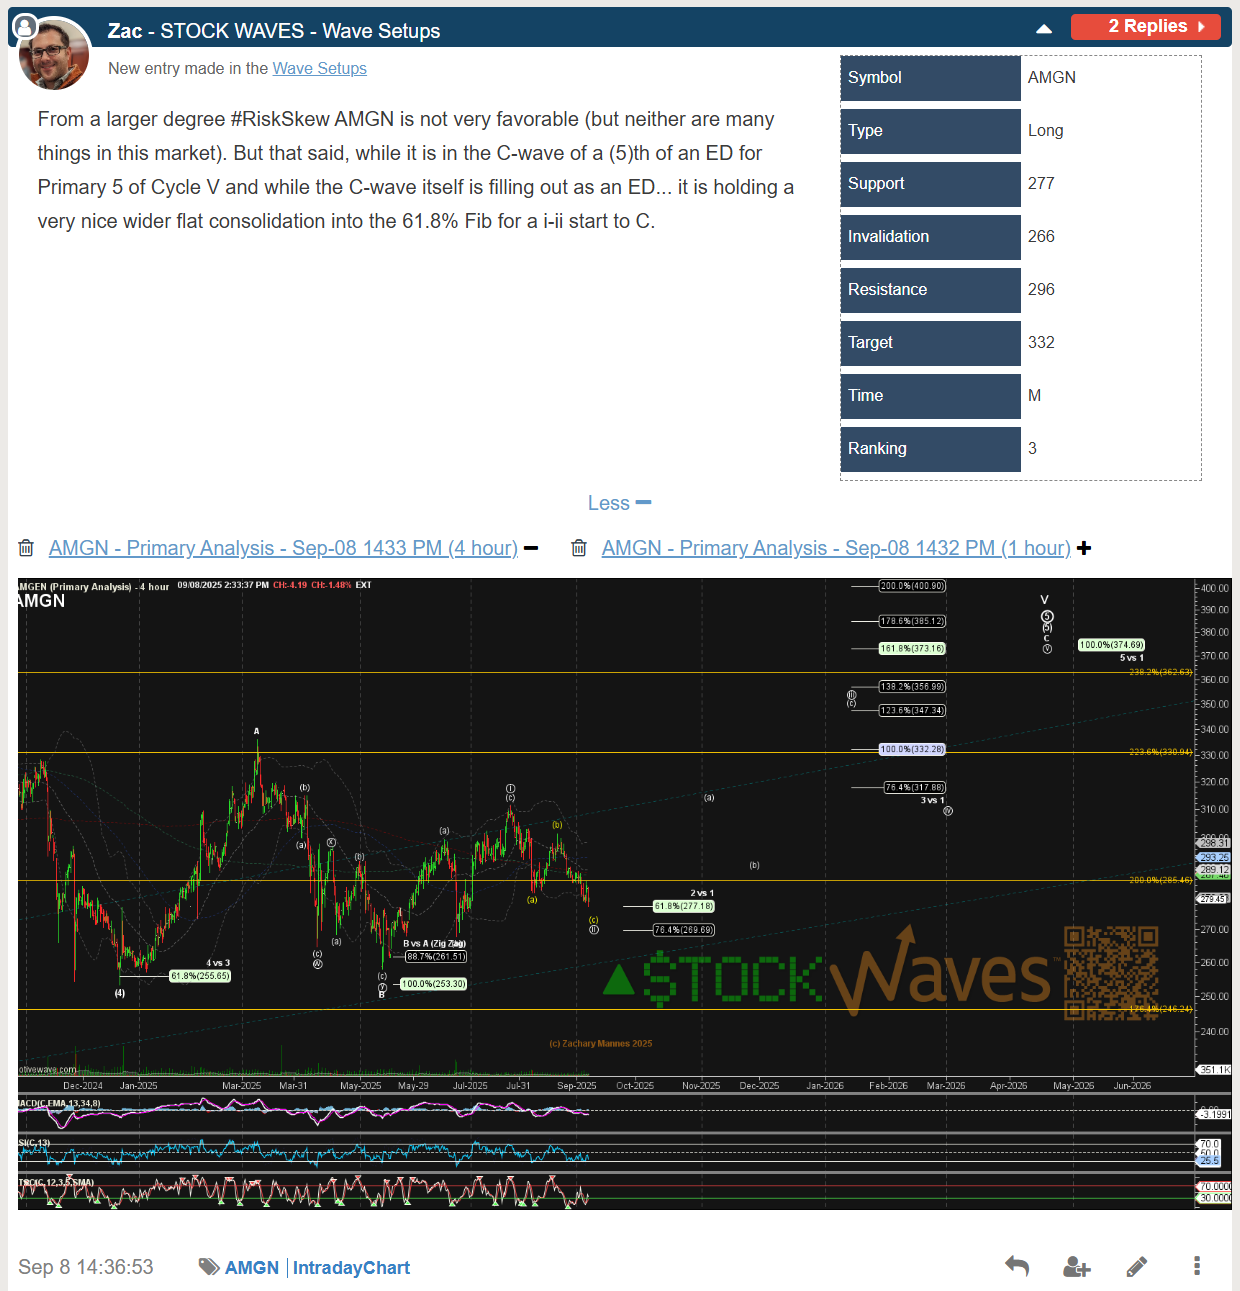
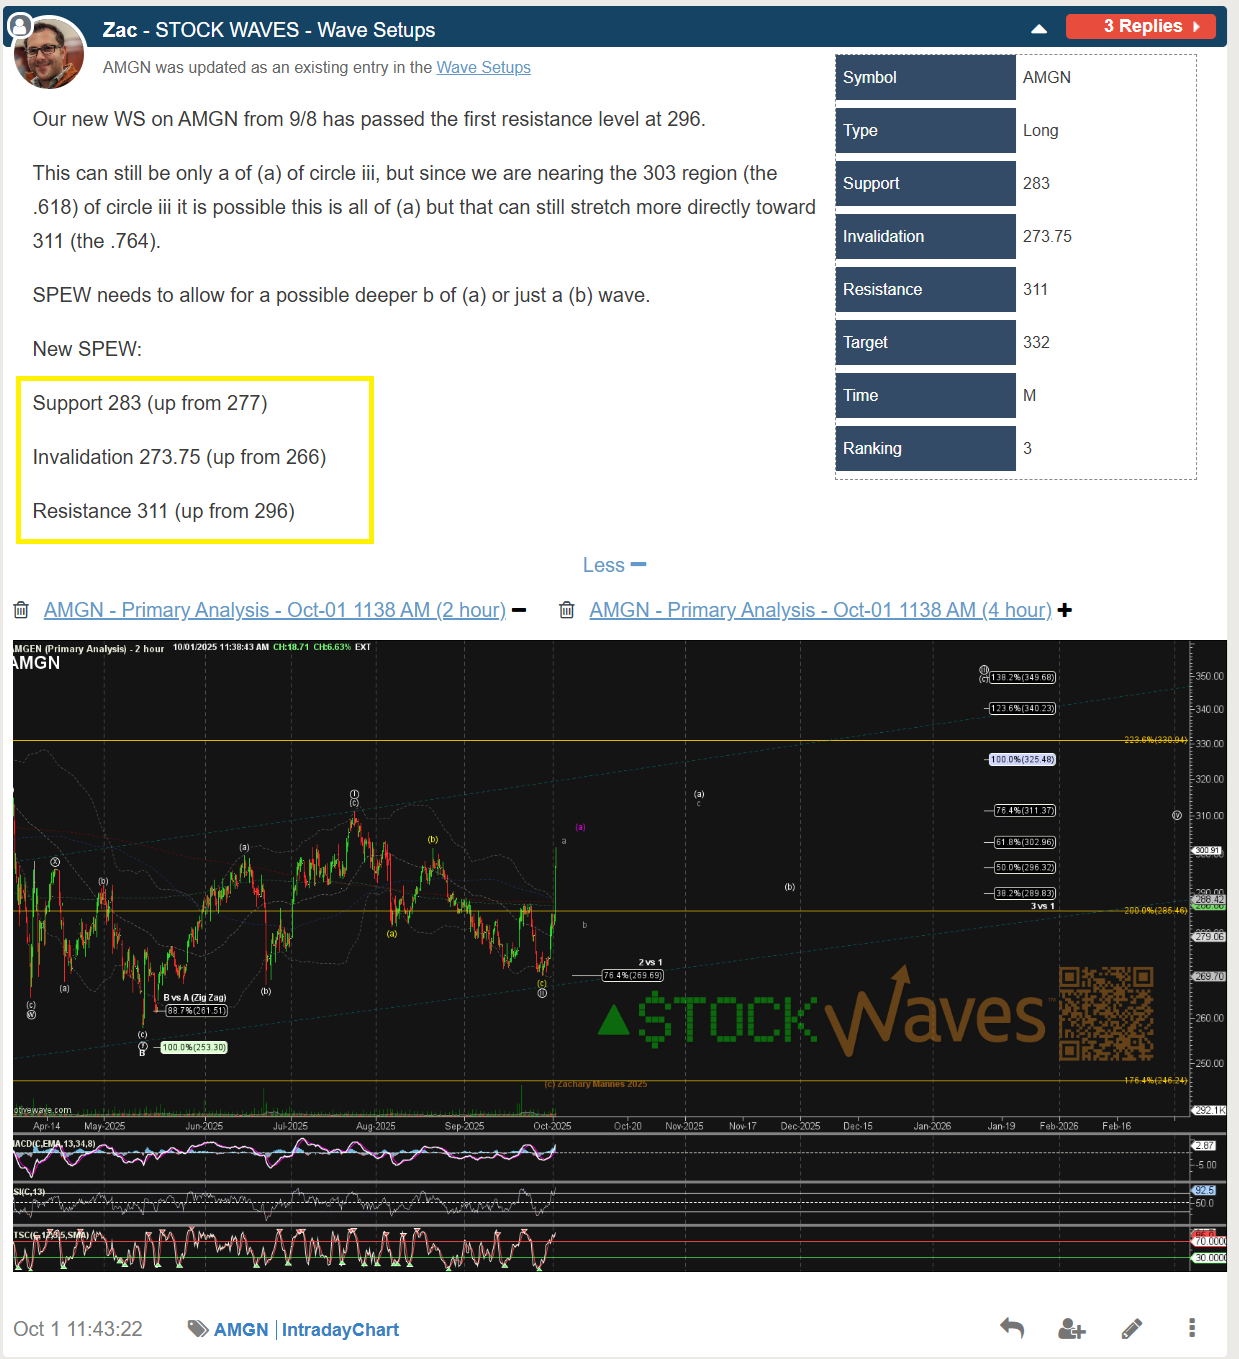
By October 1st, price rocketed higher to the first resistance level in the Wave Setup based on the diagonal structure. Thus, a formal update to the Wave Setup was issued which increased resistance and support levels to match the pattern:
Regular updates to the chart were issued over the next month as price took a fairly direct path and pushed over resistance levels.
A short 6 days later, price hit and exceeded the original Wave Setup target. 🎯 This was accompanied by some thoughts about stop management. I personally took profit and sold the vast majority of my position at this time as the Wave Setup had been satisfied.
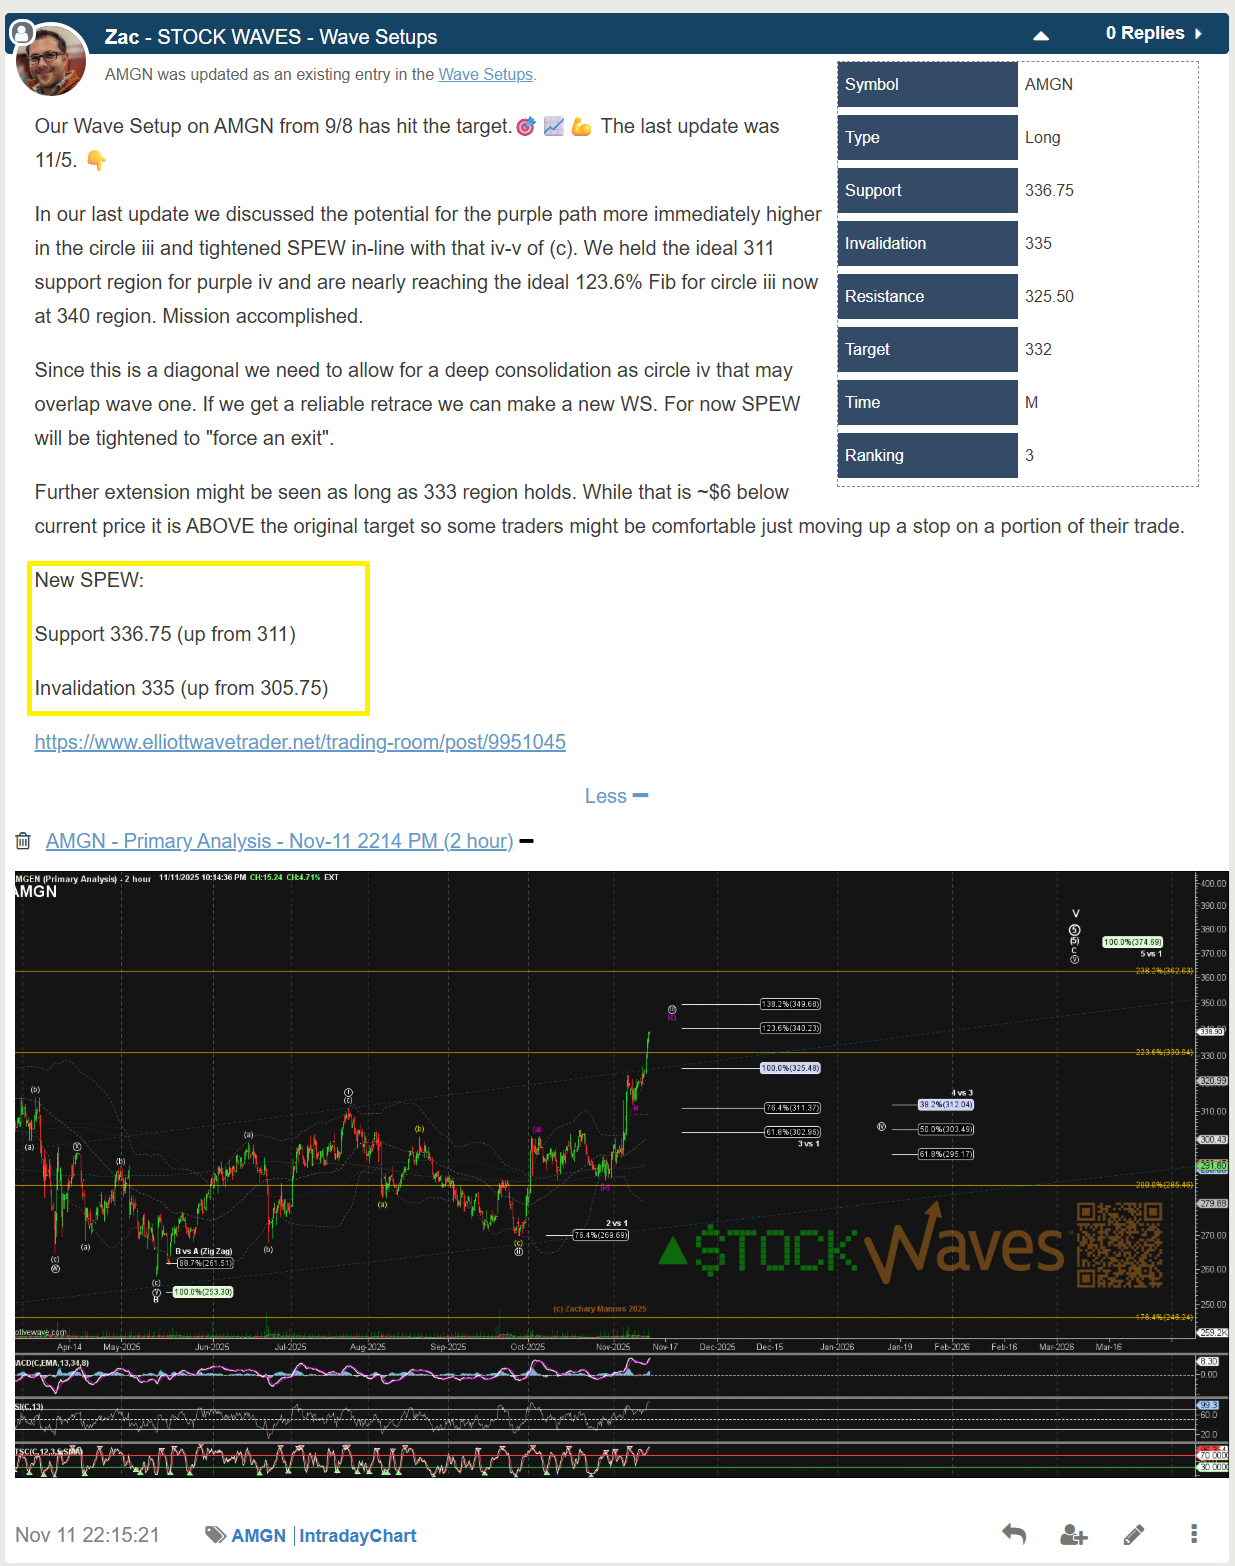
We have noted that AMGN has had quite a pullback and is again at the top of support identified in the Nov 11th update. In the larger picture this is approaching a VERY large degree potential top, in a cycle degree wave V. Stock Waves will continue to track this chart and if it presents another probability setup in the future, we will identify those parameters for our members. However, the vast majority of the upward movement in this chart has completed if one zooms out to a weekly candle view.
There is something I find inherently beautiful in the ebb and flow of the Market. It isn’t linear and despite the increased use of machines and programming, it is never lacking emotion. People and machines are always responding to something. Sometimes the input to that response is news, sometimes it is a price change, or sometimes it is pure speculation about some future event. However, all of those things can be boiled down to create a pattern between time and price.
Utilizing math and pattern recognition we have taught many of our members how to separate that emotion from their trading outcomes. Analysts use these tools, experience and expertise to identify charts that have the potential to follow a projected pattern. That to me is the beauty of Elliott Wave Theory combined with fibonacci levels. It doesn’t depend on the economics, news or the latest report. It tracks the sentiment of the herd. Not all the patterns are the same or at the same point in the progress of their patterns. We treat every chart as an individual pattern. It might be in sync with other charts for a period of time or fit into a category, but each chart has its own sentiment.
What’s next in Stock Waves? We continue to identify high probability setups for our members on a weekly basis in both the up and down directions. Be it the high beta flyers, precious metals miners or the strong and steady movers, Elliott Wave Theory works best on highly liquid charts with clear patterns. Come learn how to fish for yourself at elliottwavetrader.net.
