Almost All Internal Indicators On Sell Signals
 By
By
In last weekend's update, we wrote: "Price action is bearish short term, neutral to bullish medium term and neutral long term. ... Looking at price by itself on a weekly basis, there is nothing terribly wrong - consolidating sideways after a big week - but the complete giveback of the Thursday rally on Friday is disappointing action by the bulls. So I think caution here is warranted…we can hold around here and attempt another higher toward 4200 area.. but price seems to be getting rejected above 4150 closer to 4200.. and getting sold off to test support at 4100/4080 repeatedly. Below this support we have 4040 area that is important.. and losing that will mean a test of the lows again near 3900 area and below. Looking at the daily, I can see a wedge forming and this is not a good picture for the bulls because it would also mean a retest of the lows once the 4050/40 area is broken."
Caution was certainly warranted as 4040 broken on the Emini S&P 500 (ES) and we ended the week at the 3900 area.
Looking ahead to this week, price action is bearish short term, bearish medium term and bearish long term. Almost all internal indicators are on sell signals as well. NAAIM sentiment indicator went to a sell couple of weeks back and I am on the lookout for a buy signal to show up there in the coming week. Price broke 4040/20 support area and made a quick move to 3900. Next support area is at around 3860 and below this the 3800 area. I think there is a decent chance of us holding one of those areas. If they go, then 3750/3700 area is likely next. On the whole, I think that we are very close to an important low timing wise in the next 4-7 days, but price-wise I am not sure. It could form some kind of double bottom similar to March price action… or it could make a lower low in 3750/3700 area. At this point, I do not see much more than that and I am looking for a rebound rally to set up soon after into the 4250/4350 area. What happens after that? I do not know at this point and a lot will depend on how price structure and internal indicators look at that point.
Looking at grey zones and pivots, grey zone resistance at 3944-60 and then 4015-31. Support is at 3900/3891, 3871-54, 3816-02 and then the 3750 area.
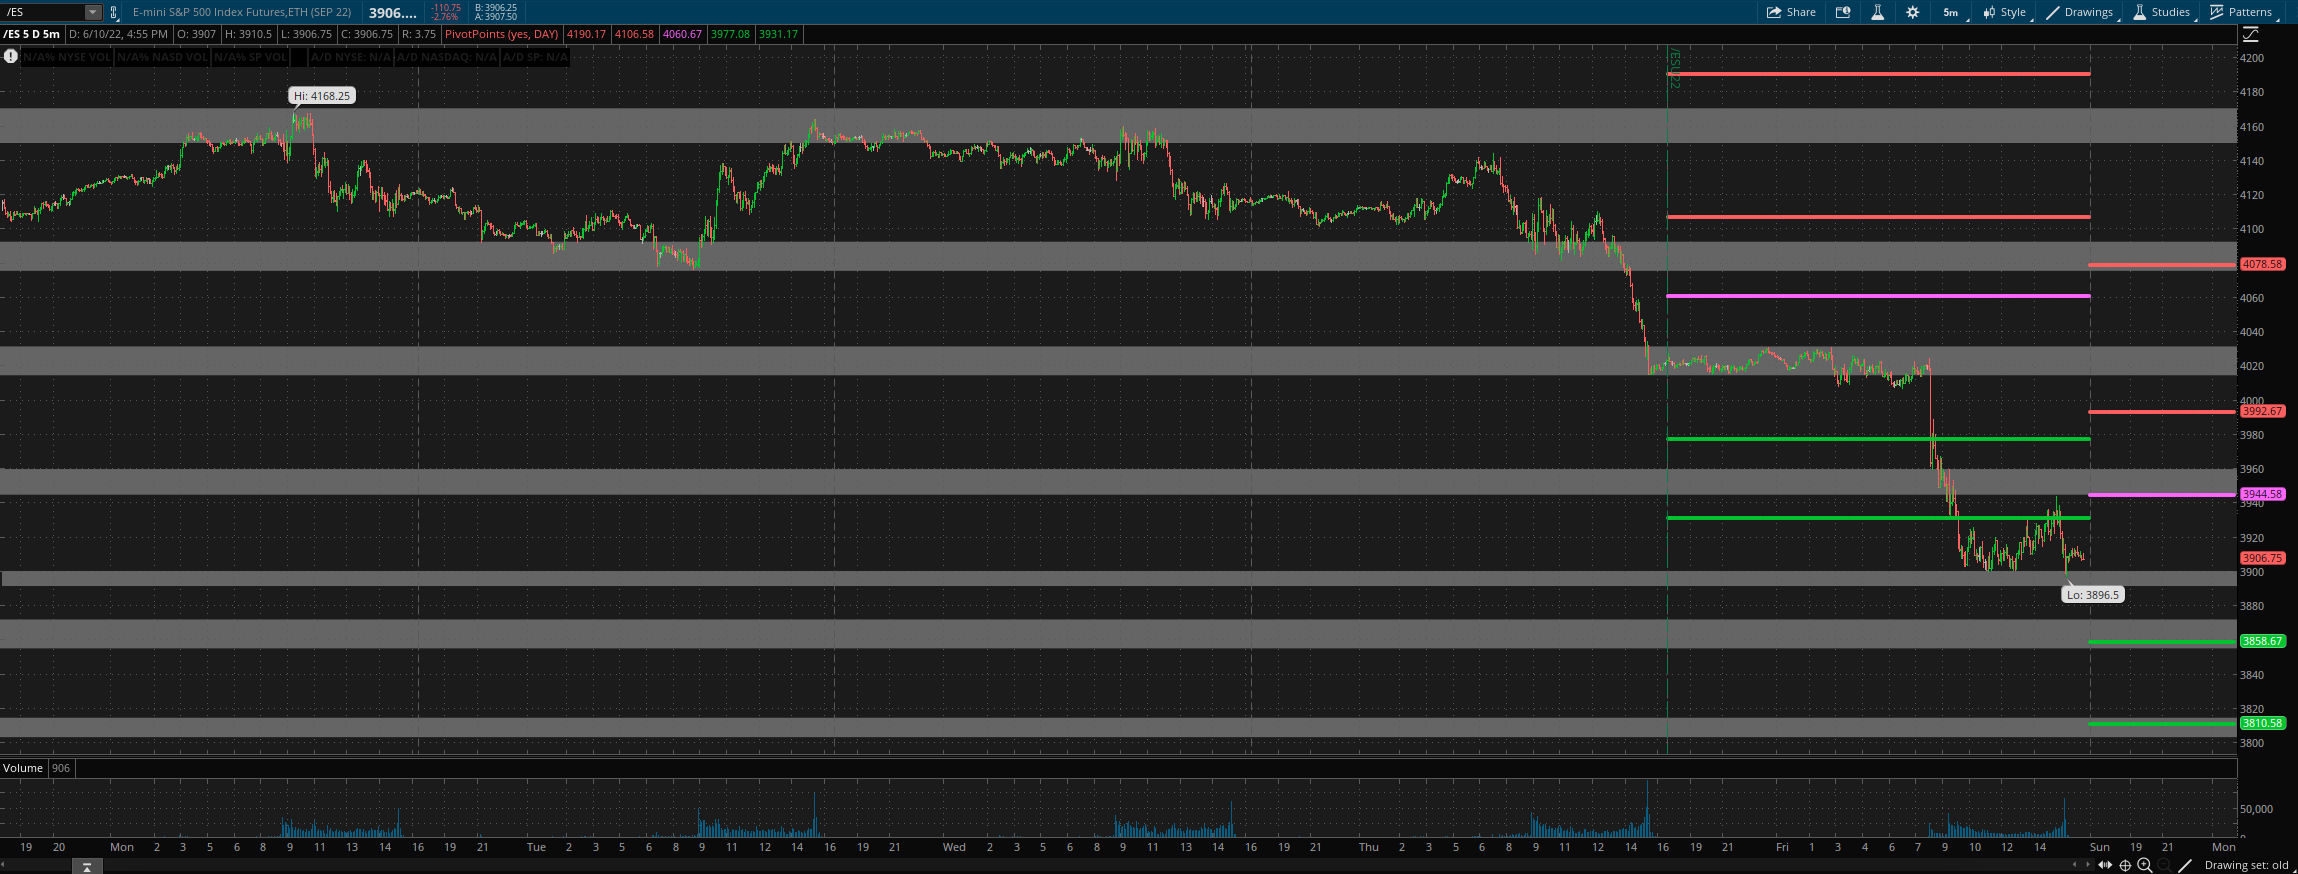
For Monday, daily pivot is at 3944.5. Resistance R1 is at 3992.5 and R2 at 4078.5. Support S1 is at 3858.5 and S2 at 3810.5.
All the best to your trading week ahead.
