All Models Bearish - Market Analysis for Mar 8th, 2020
 By
By
All models are bearish right now. My thought is that correction is closer to the end in terms of time (2-4 weeks), but it is not close to the end in terms of price. I think we are going to get a bigger bounce higher in the coming week maybe after a retest of the Friday lows. And once we get this, it should set up the final move lower to new lows below 2850 -- somewhere in the 2600-2500 area, maybe as worse as 2450.
But first I think we bounce/correct higher after a possible retest of Friday lows. As always, we will use our indicators to manage our trading.
ES Grey Zone areas: The grey zones on the ES 5 min chart below are what I draw in on a discretionary basis -- they are support and resistance areas which the market is most likely to react from. If we test a zone from below, it is likely to be rejected and fall lower to test support zones below. If we test a zone from above, it is likely to take support there and begin a move higher. So these zones can be used for intraday trading and/or as entry points for positioning for swing trades. These zones are drawn in based on what the market has done there previously both on smaller and larger timeframes.
Grey zone resistance at at 2972-78 and 3028-38. Support is at 2910-2897 and then at 2859-51 area.
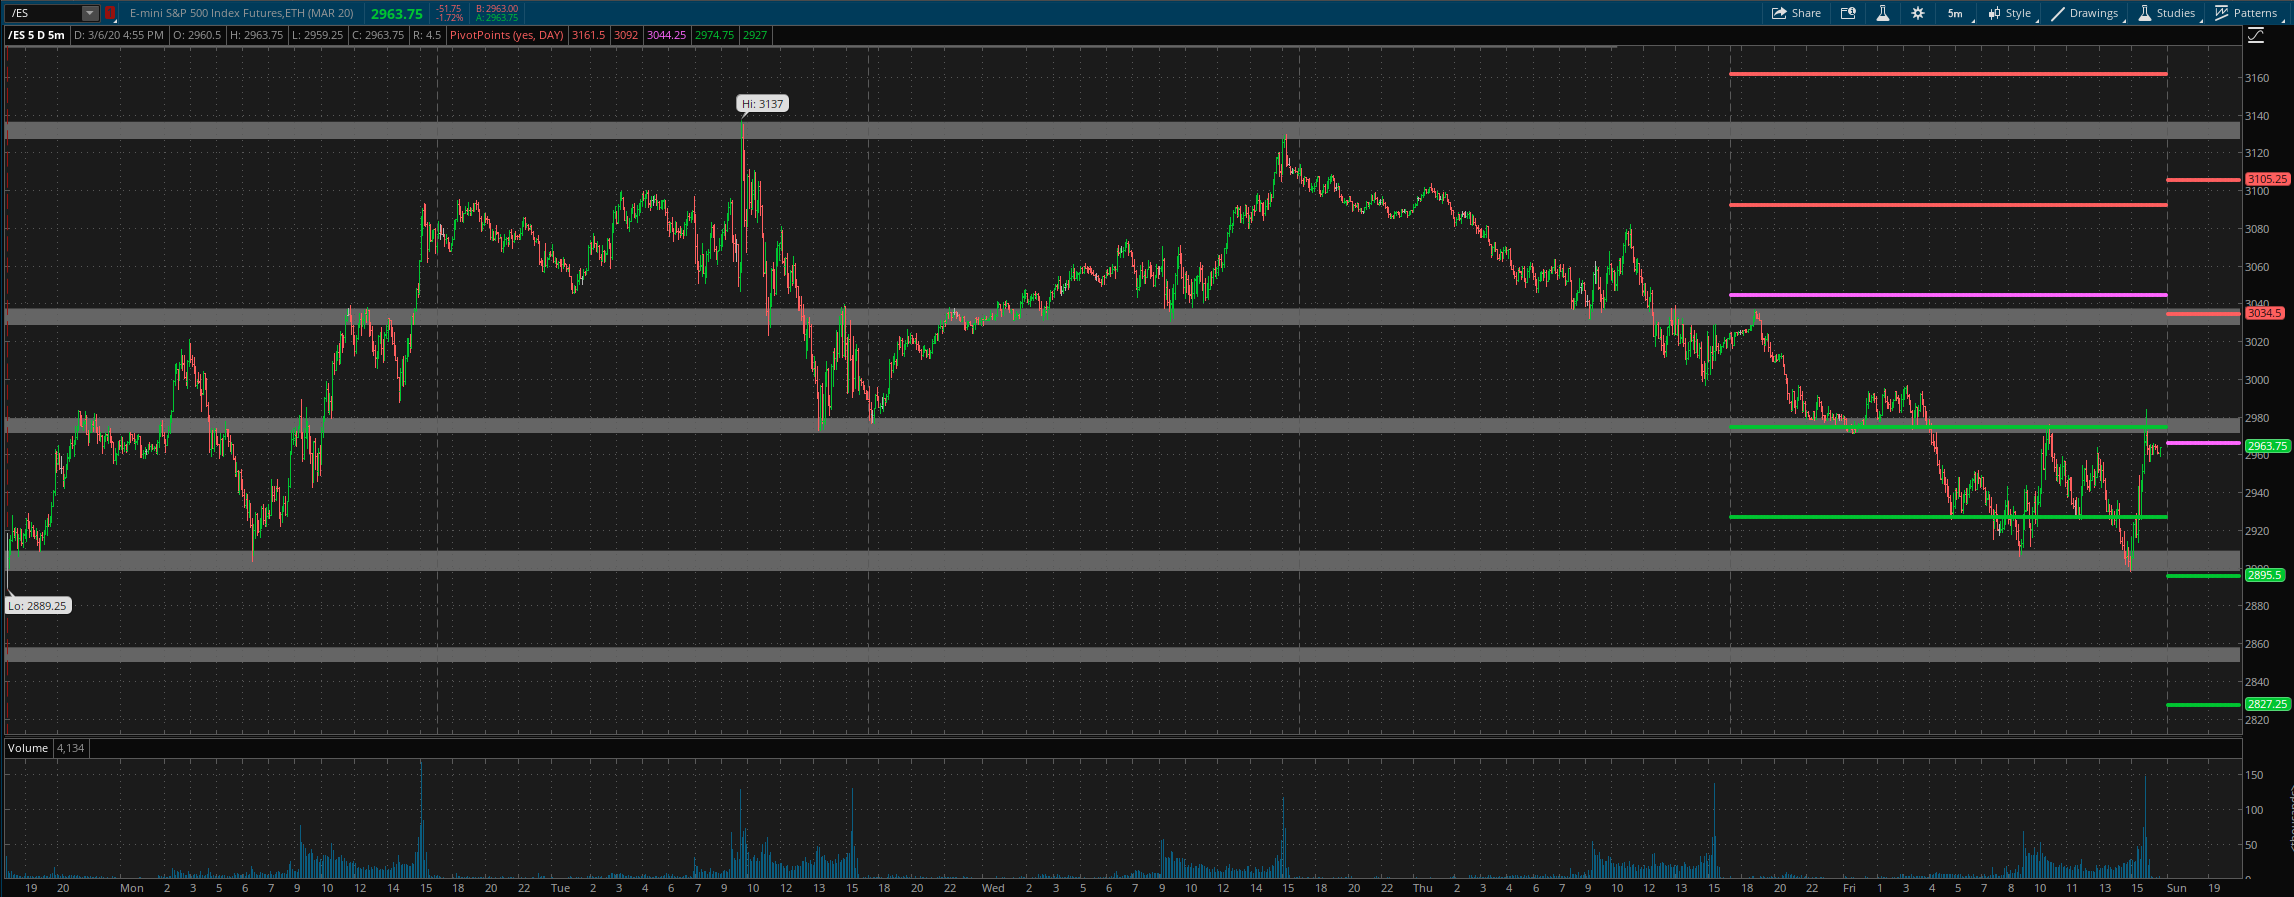
Daily pivot is at 2966. Resistance R1 is at 3034.5 and R2 at 3105. Support S1 is at 2895.5 and S2 at 2827.
All the best to your trading week ahead.
