A System for When to Buy & When to Sell
 By
By
NYHL1M and the Secret Indicator Combo
Wouldn’t it be nice to have a system that tells you when exactly to buy and when to sell? When to short and when to cover? Something that is not too early. Something that does not attempt to call tops or bottoms. Something that uses actual quantifiable data to align with the predominant trend?
That is exactly what the NYHL1M system and the Secret Indicator Combo does. Is it the holy grail? No definitely not. Is it a vastly superior system? Definitely yes. This is something that I wish I had 10 years ago. At that time I too was busy trying to catch tops and bottoms….
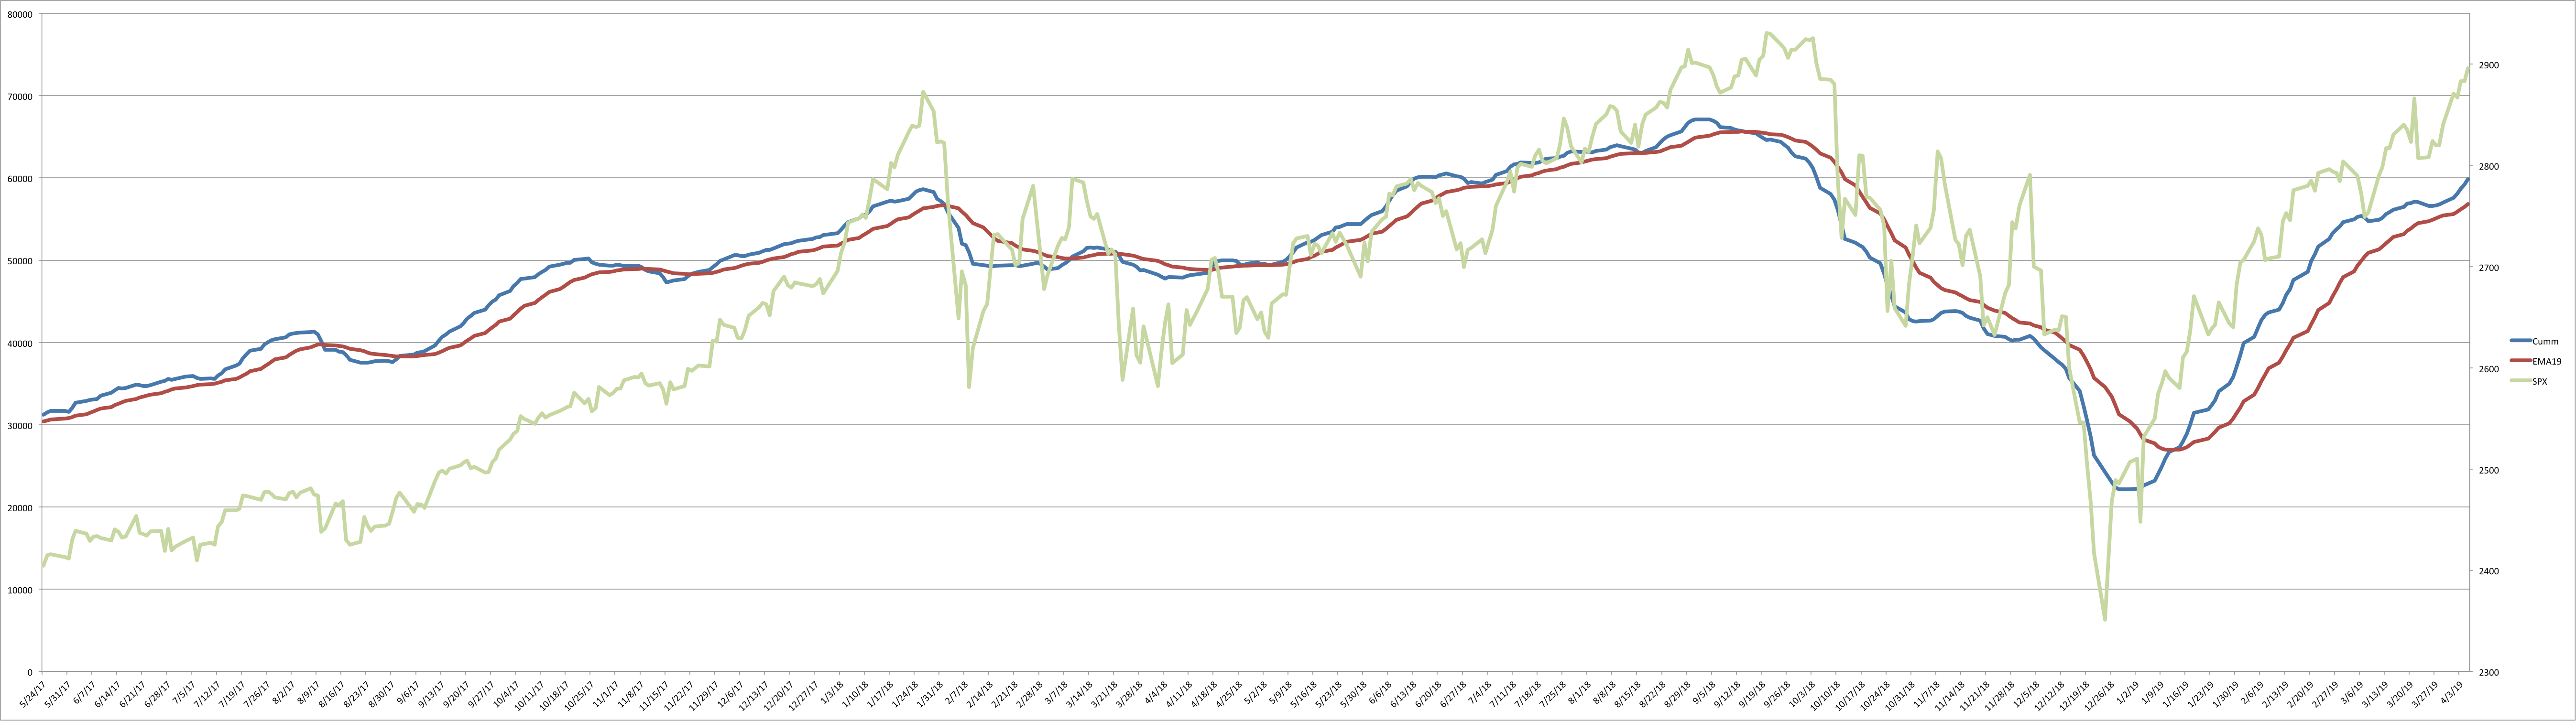
NYHL1M chart as it looks today -
Below is the history of the indicators since we have been tracking them in the Smart Money Room. Green is open/active. Grey is old/closed.
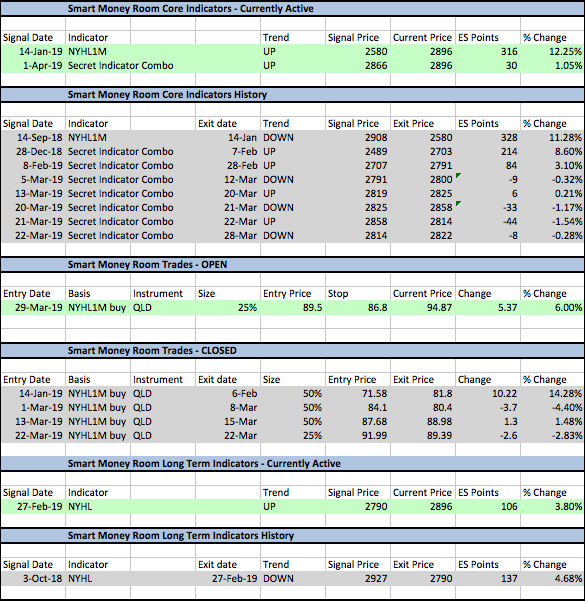
NYHL1M went to a sell on Sep 14 last year. ES was at 2908. It went back to a buy on Jan 14 this year capturing 328 points. Since the buy on Jan 14th when ES was at 2580, to date, it has captured 320 points. Will it always be this successful? Most likely not. But on balance, it will work quite well.
The secret indicator combo is a little more sensitive and why you see more signals/in and outs.
The beauty of these indicators or systems is - no need to overthink anything. You let the market internal data tell you what the market trend is and you align yourself to this trend.
Have I done this alignment to the trend perfectly? No not really. I have attempted to outsmart the indicators trying to time the entries in and out - as you can see from the QLD trades in the table above. Could have done much better in % terms but not too shabby nonetheless. I do have a much more concrete and more mechanical plan in place right now to make this alignment easier and with lesser drawdown.
Humans are emotional. Being emotional causes us to make dumb mistakes. Mechanical systems remove this from the equation. Or atleast reduces it to manageable levels.
An example of how following mechanically helps… The last trigger on the secret indicator combo was few days back at 2866 - long - without having something like this tell us to go long, how many of us could pull the trigger long there? Or my QLD trade from March 29th just a few days back. I got a micro signal long and took the trade. Small size but still it is up 6% today….. On both these instances there were many reasons as to why the market was going to fall… and taking those trades were hard… being mechanical or having a clear cut system helps us by taking emotion out of the equation
Not being long in this uptrend and watching it rip upward without you is not great. Being short is much worse. The best thing I can say after beginning to follow these indicators religiously is that - I have not even attempted to short the market since Jan 14th when the NYHL1M went to a buy.
What’s new in the Smart Money Room?
We now have Trades and Indicators entries and exits/buy and sell signals tracked in table form in the Smart Money room. Trades are provided with entries, stops and exits. I posted the screenshots in this post - https://www.elliottwavetrader.net/members/atchat/?threadId=5202052
If anyone wants to know more about what we do in the Smart Money room, start with this video I did recently -
Have a great weekend all!
