A Real Breakout or A Bull Trap?
 By
By
Last week was a strong week for the bulls with price closing above the range of the past several weeks. Internals did improve somewhat during the latter half of the week, at least on the short term timeframes. Longer-term timeframes still show as bearish.
While price did break out of the range on Friday, I am on the lookout for signs that it may fall back into the range. We are overbought now across different timeframes, so some kind of pullback looks very likely near term. The type of pullback that plays out will tell us a lot on what next.
With the very narrow breadth we are seeing on this advance, I have a lot of difficultly seeing this bullish action as sustainable. We should know more in the next few days if this is a real breakout or if it ends up as a bull trap. I am leaning that it’s the latter, but price action is king. Price action is bullish short-term, bullish medium-term and neutral long-term. We are flat in swing trading accounts.
Grey zone resistance at 4294/4305 and then in the 4340 area. Support is at 4260-46 and then 4237-20.
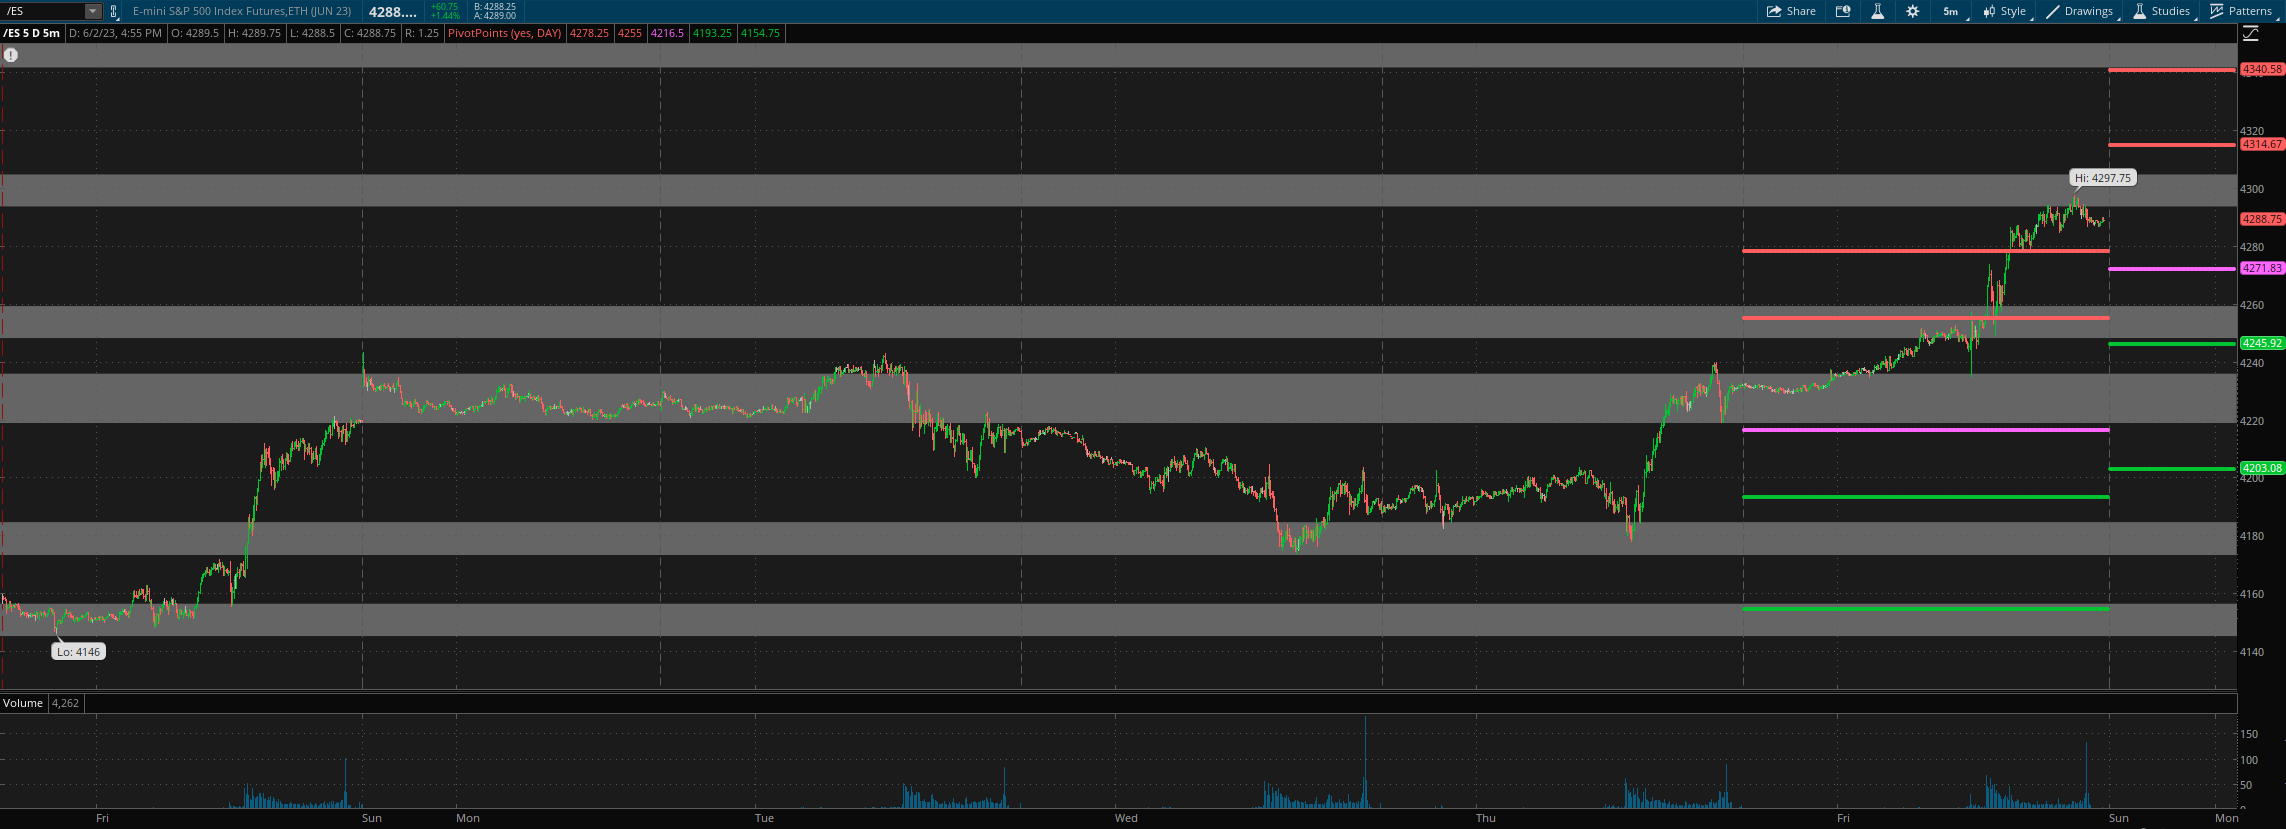
For today, daily pivot is at 4272. Resistance R1 is at 4315 and R2 at 4340.5. Support S1 is at 4246 and S2 at 4203.
All the best to your trading week ahead.
