A Lot Of Mixed Signals
 By
By
In last weekend’s update, we wrote: "Next up, odds can go back to a sell signal on a bounce toward 3925-50 OR it can generate a long signal on deeper pullback toward 3800/3780 with a retest of the lows or a lower low. As of now, both options look equally probable although I am leaning toward another sell signal and short re-entry from higher. Most internal measures stay on sell signals -- these going back to buys will be the first sign that the bulls have something to work with -- right now this is just a bounce to relieve the oversold conditions in the market. 3920/25 is immediate resistance above and 3850/40 is immediate support below."
What actually happened is that it was a mostly rangebound week with price ending the week pretty much where it started.
Looking ahead, price action is neutral short term, bearish medium term and bearish/neutral long term. There are a lot of mixed signals here, and the market does not seem to be able to make up its mind on what's next. 3900/3920 is resistance on the Emini S&P 500 (ES) and if this is cleared, we have stronger resistance at 3950/60.
On the downside, we have support at 3800/3780, and then at the 3750 area. Most internal indicators continued on sells this week even as price stayed rangebound. And the Odds signal stayed flat. I am looking for a buy signal to set up from lower in the 3780 to 3750 area, or for a sell signal to set up in the 3920 to 3960 area. At this point, I do not have a clear bias -- both buy and sell signal look equally possible. Staying in cash is the play until we have a clear cut trade signal.
Grey zone resistance at 3862-80 and 3900-22. Support is at 3823-03 and then 3783-67.
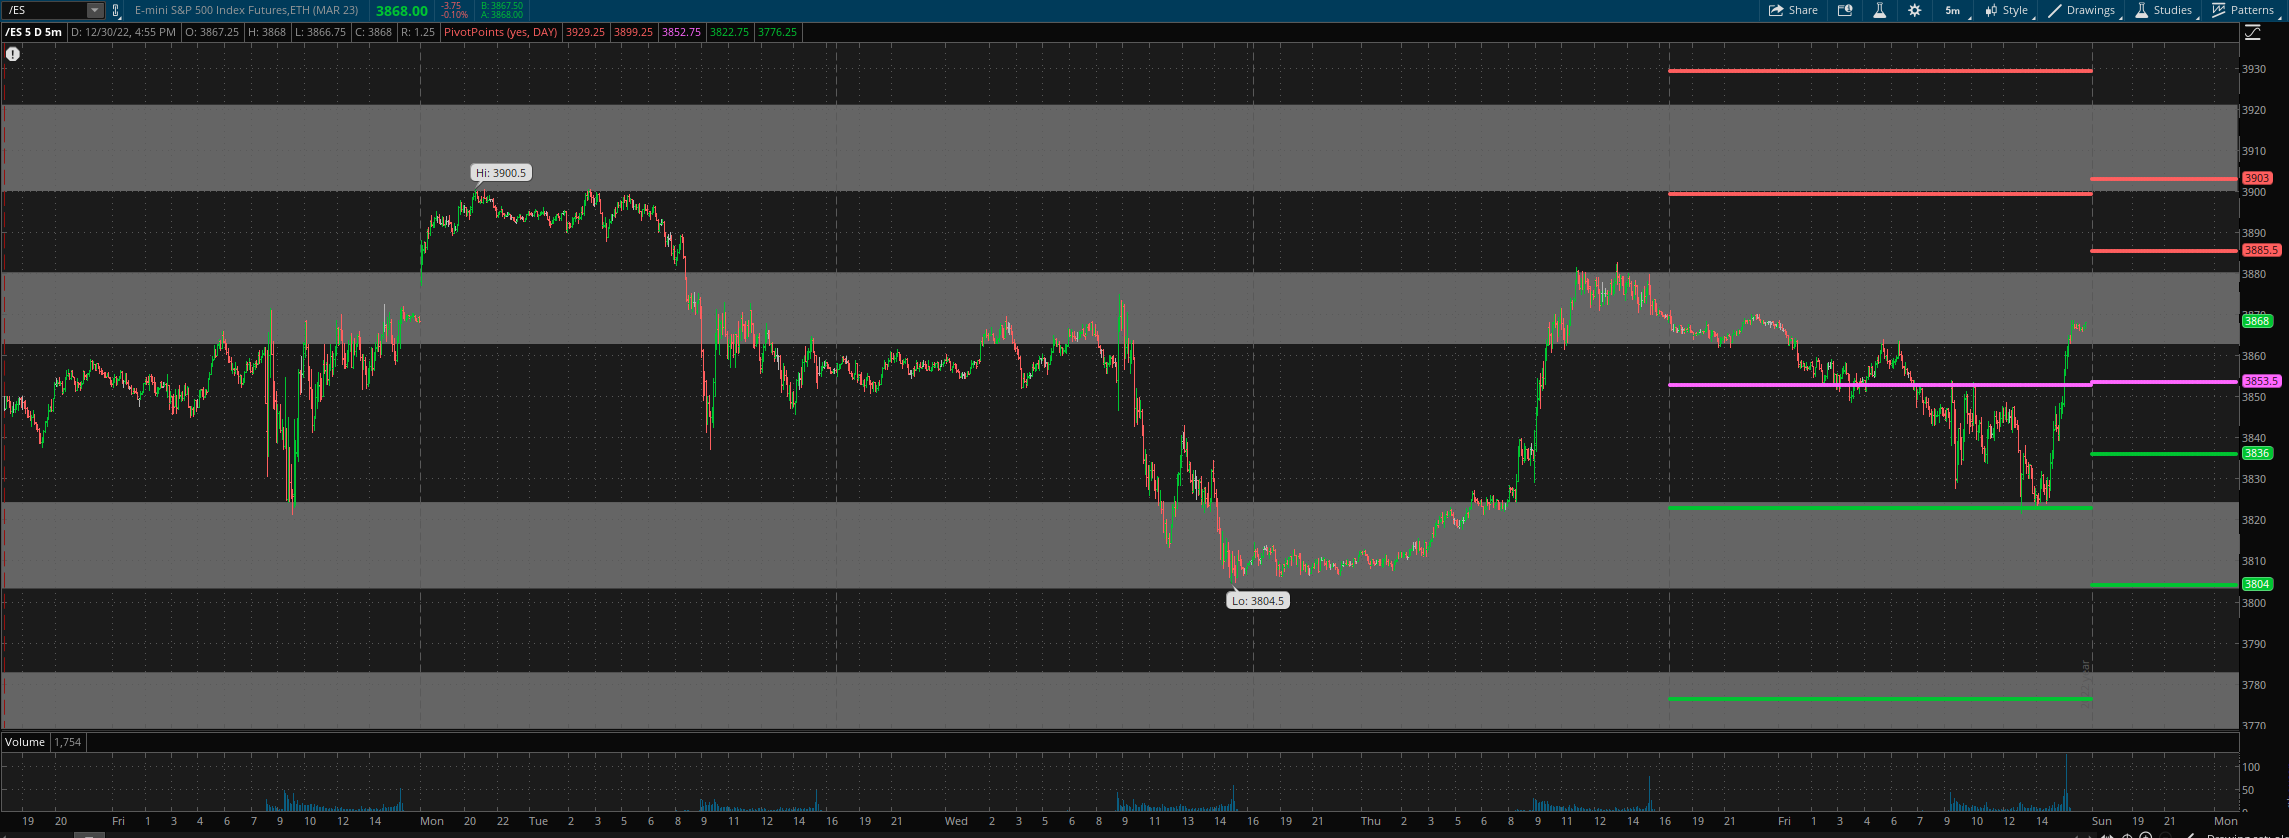
For Tuesday, daily pivot is at 3853.5. Resistance R1 is at 3885.5 and R2 at 3903. Support S1 is at 3836 and S2 at 3804.
All the best to your trading week ahead.
