5 International Markets to Watch
 By
By
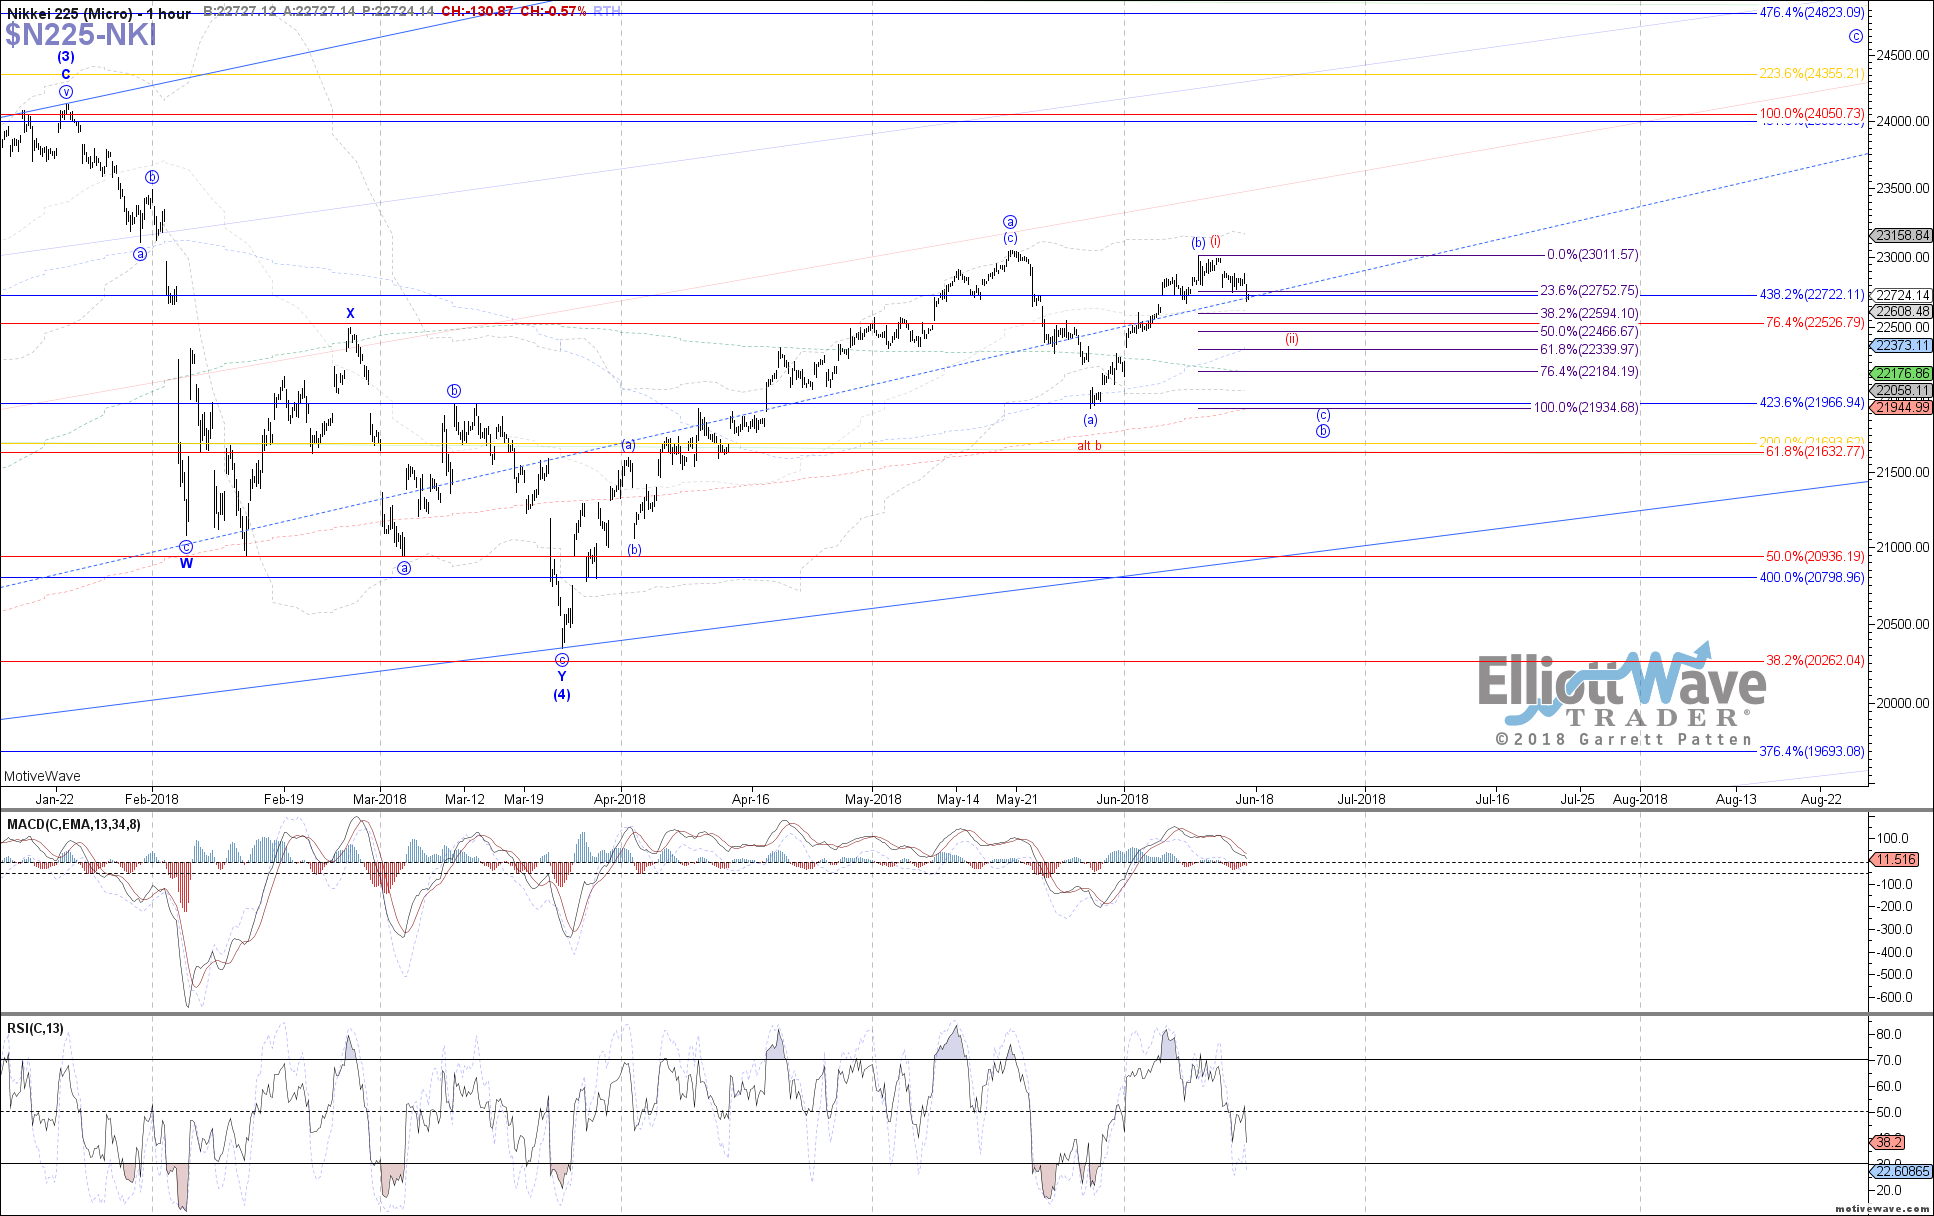
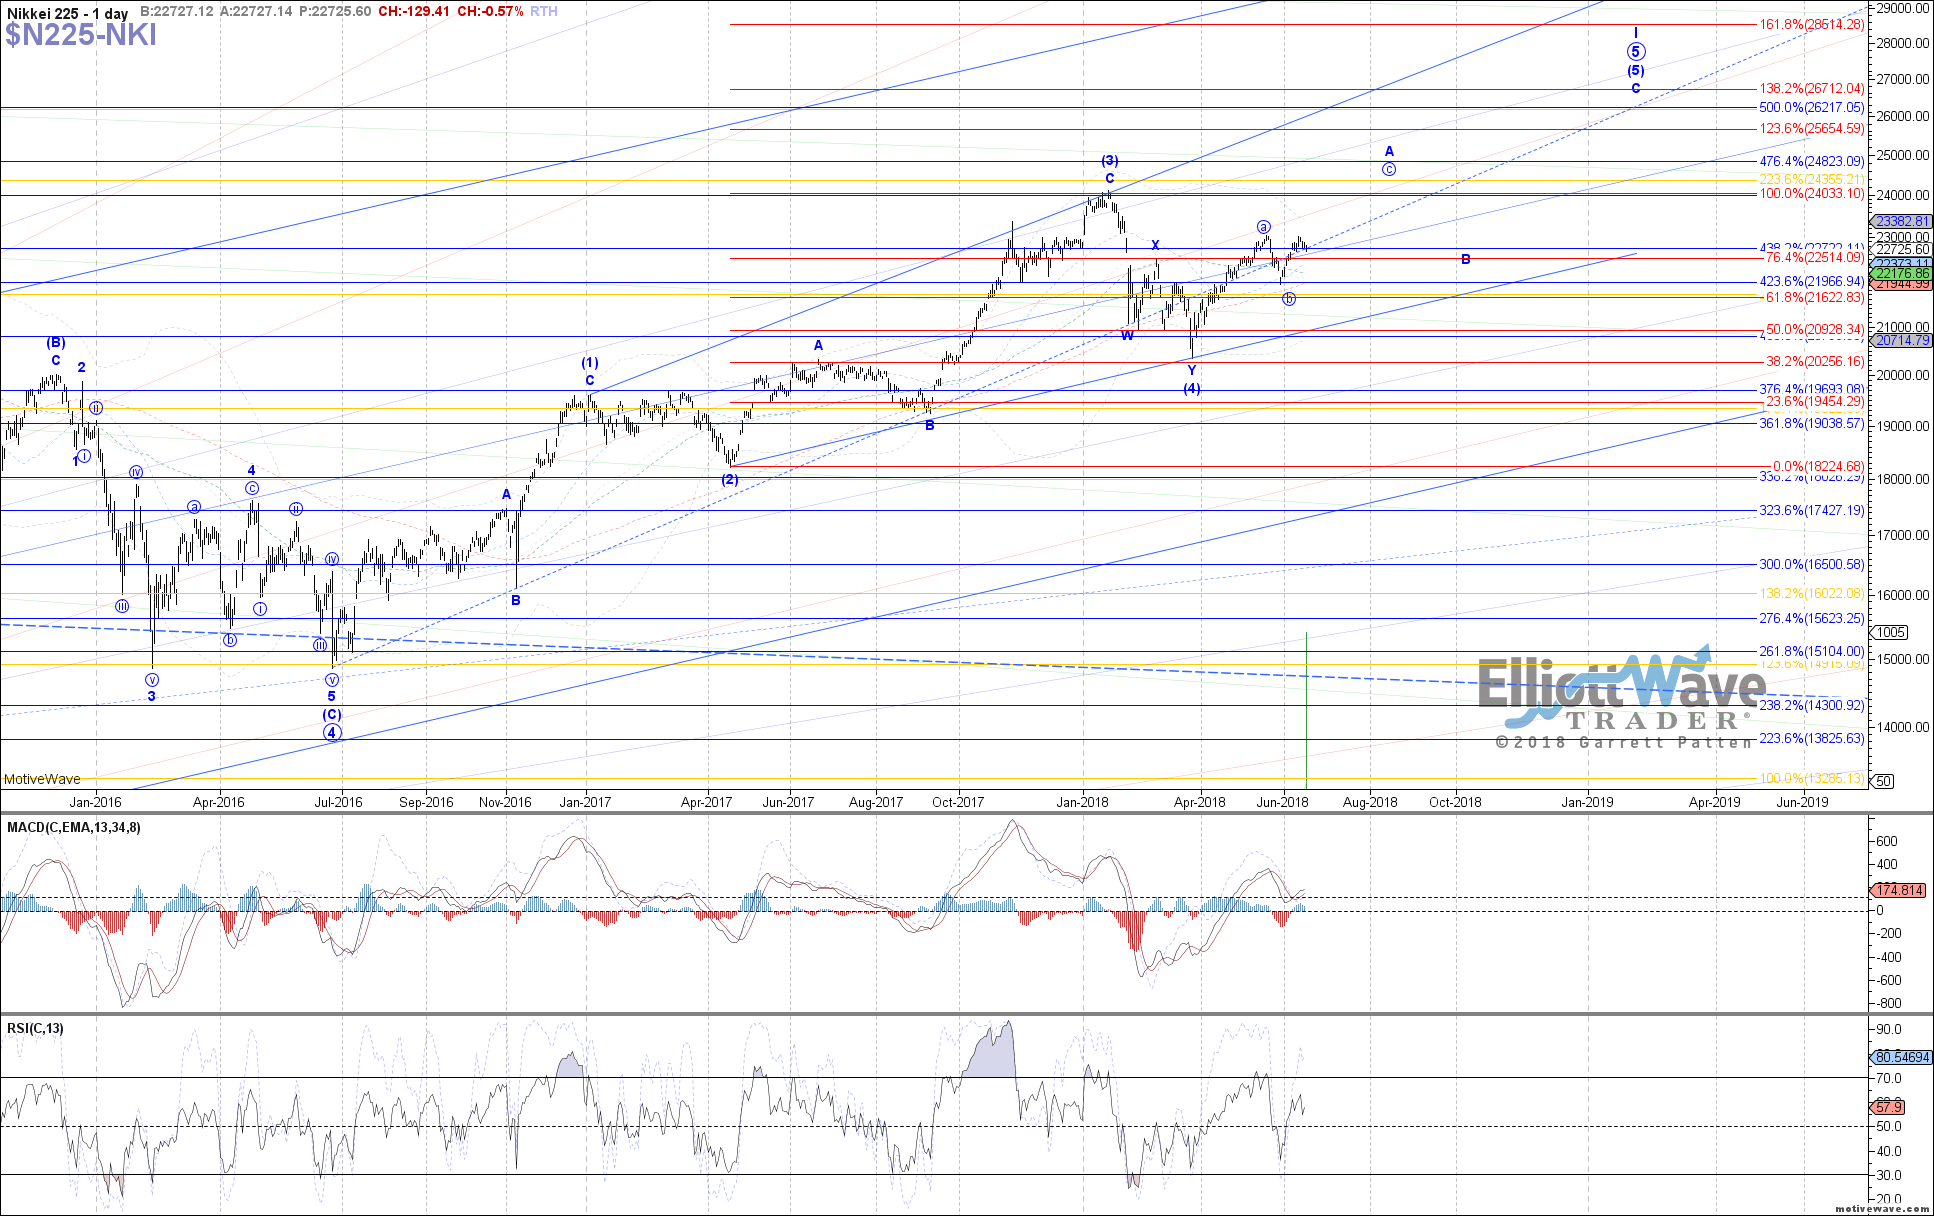
The Nikkei (N225) started off initially higher last week, almost retesting the prior May high before curling back down into Friday’s close. We should have a local top in place as either blue wave (b) of b or red wave (i) of c, with price now retracing in blue wave (c) of b or red wave (ii) of c. Support for the latter sits between 22595 – 22340, which if price holds and then takes out last week’s high afterward, would suggest that wave (iii) of c is in progress. Otherwise, below 22340 and a retest of the May low can be seen as blue wave (c) of the larger b-wave flat.
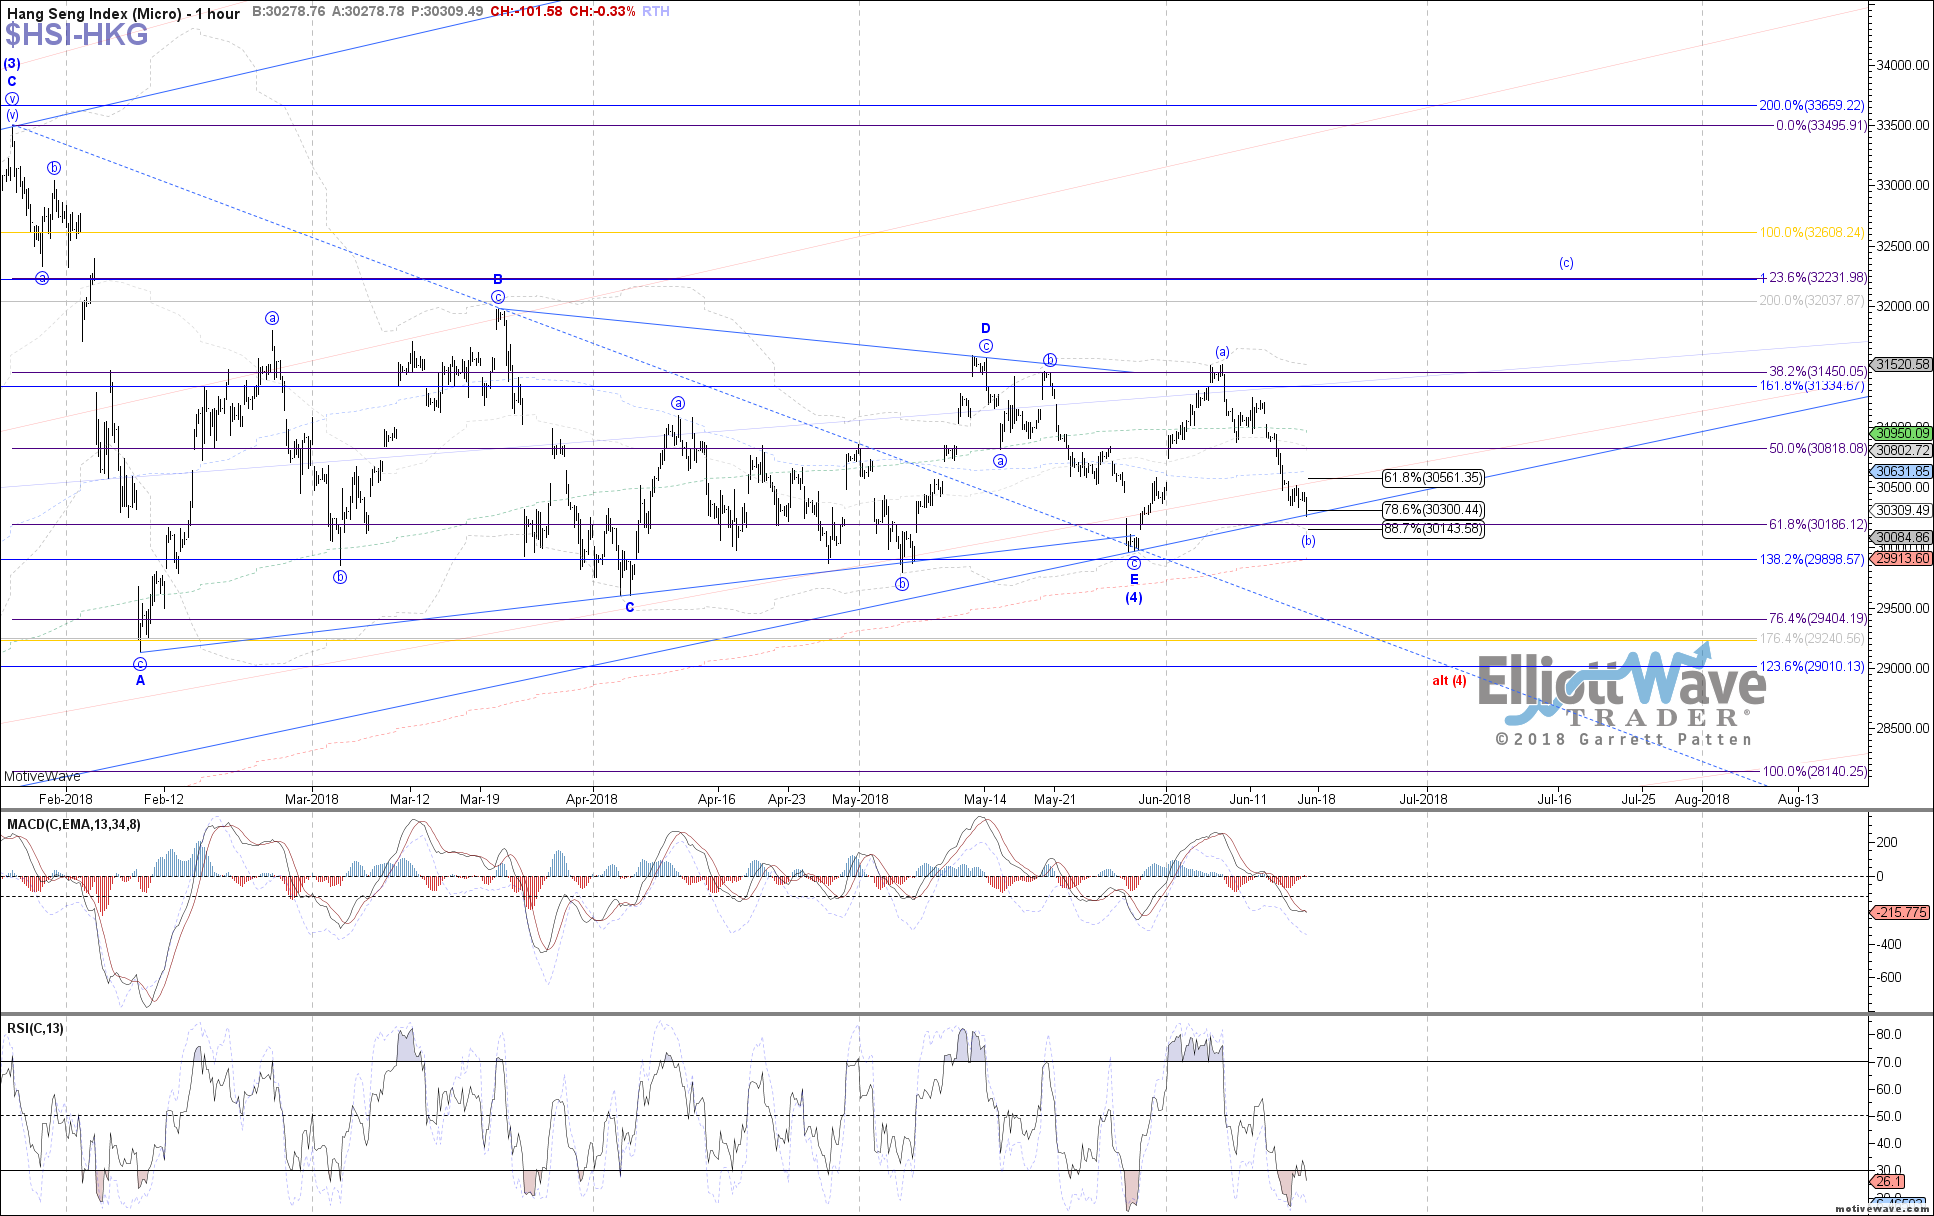
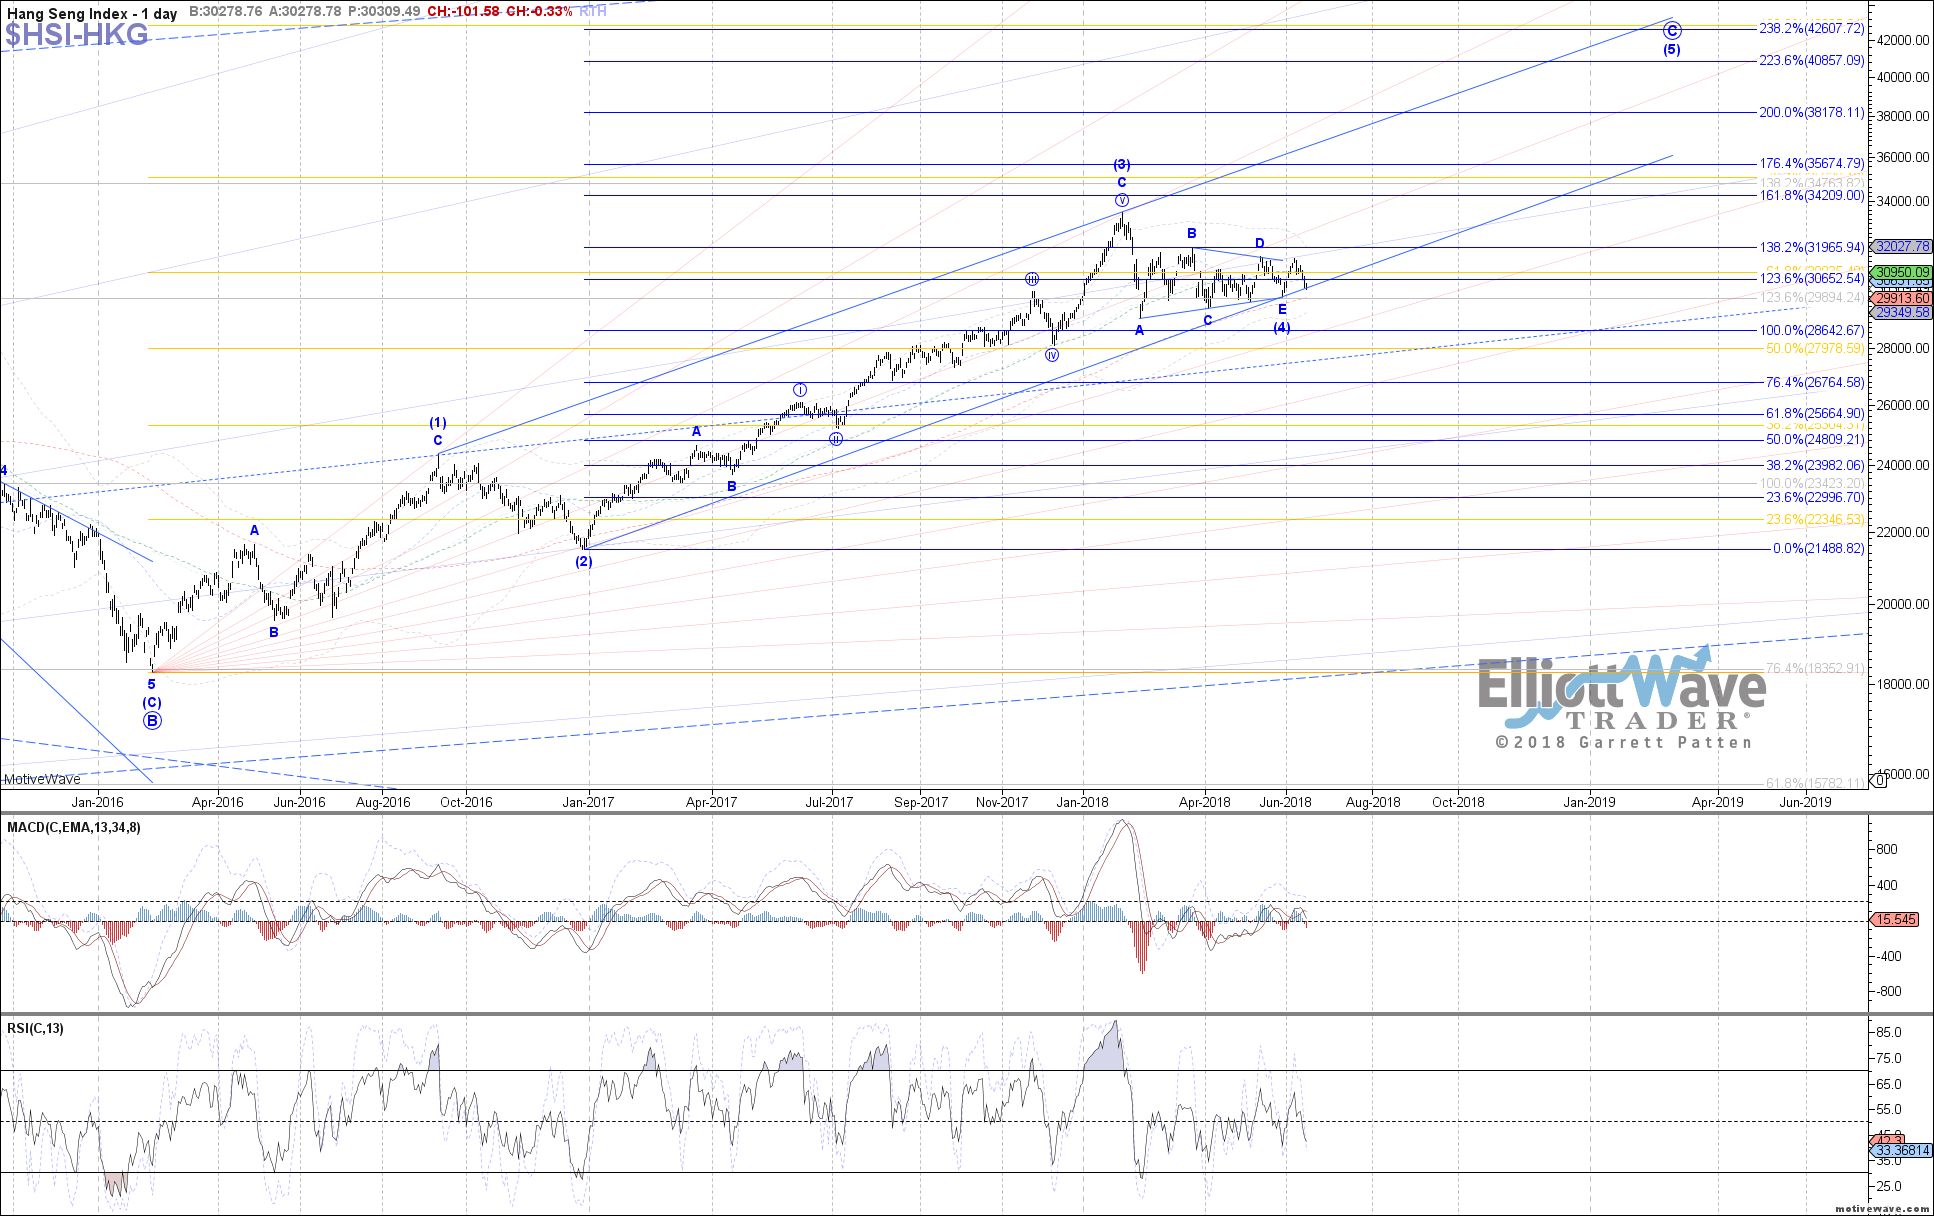
The Hang Seng (HSI) traded lower last week, eventually breaking below the .618 retrace support at 30560. This has reduced the probability of the near-term bullish outcome as blue wave (c), but that potential remains valid as long as the May 29th low holds. Otherwise, a break below there would invalidate a bottom in place for wave (4) as the triangle, opening the door to a more complex corrective pattern.
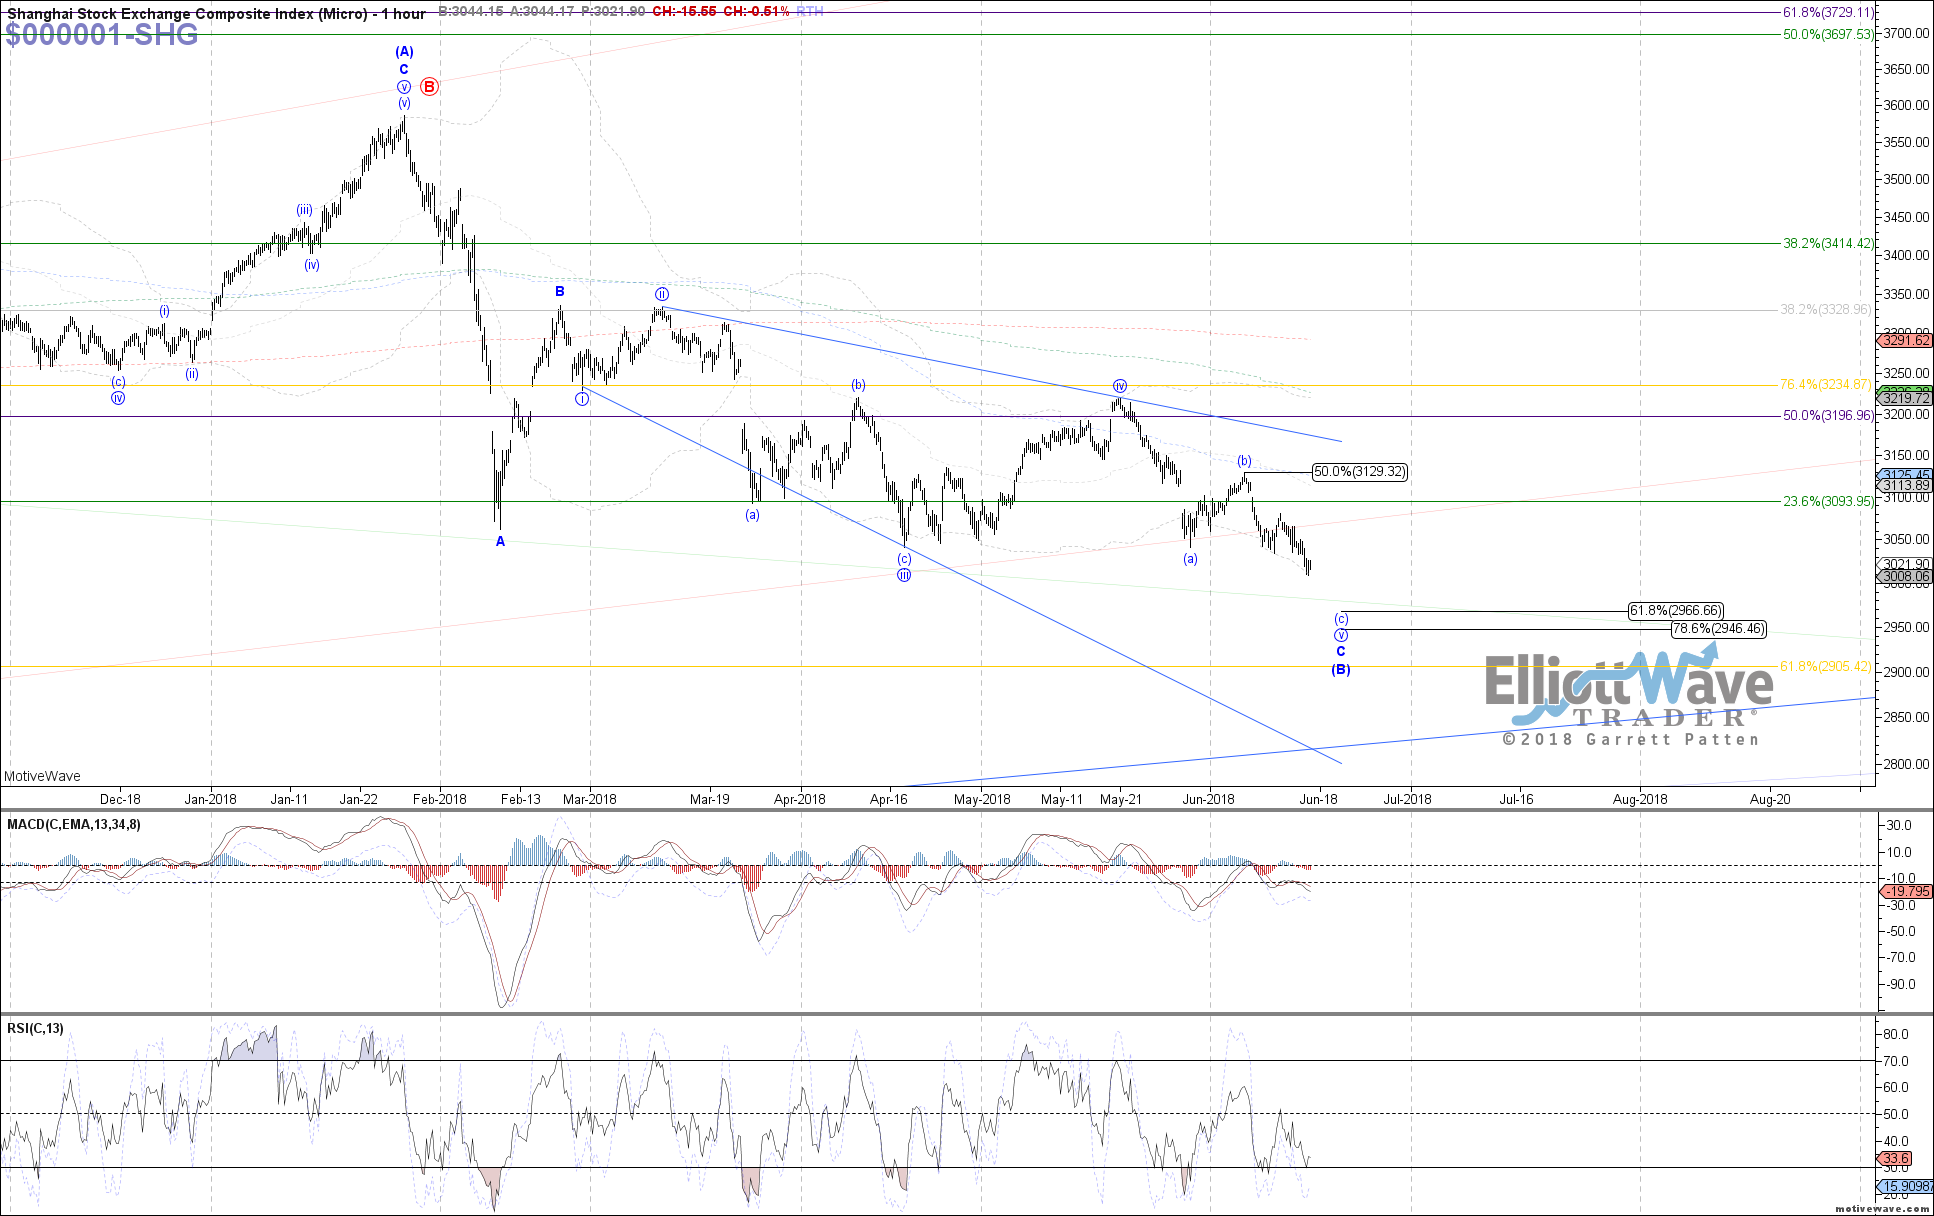
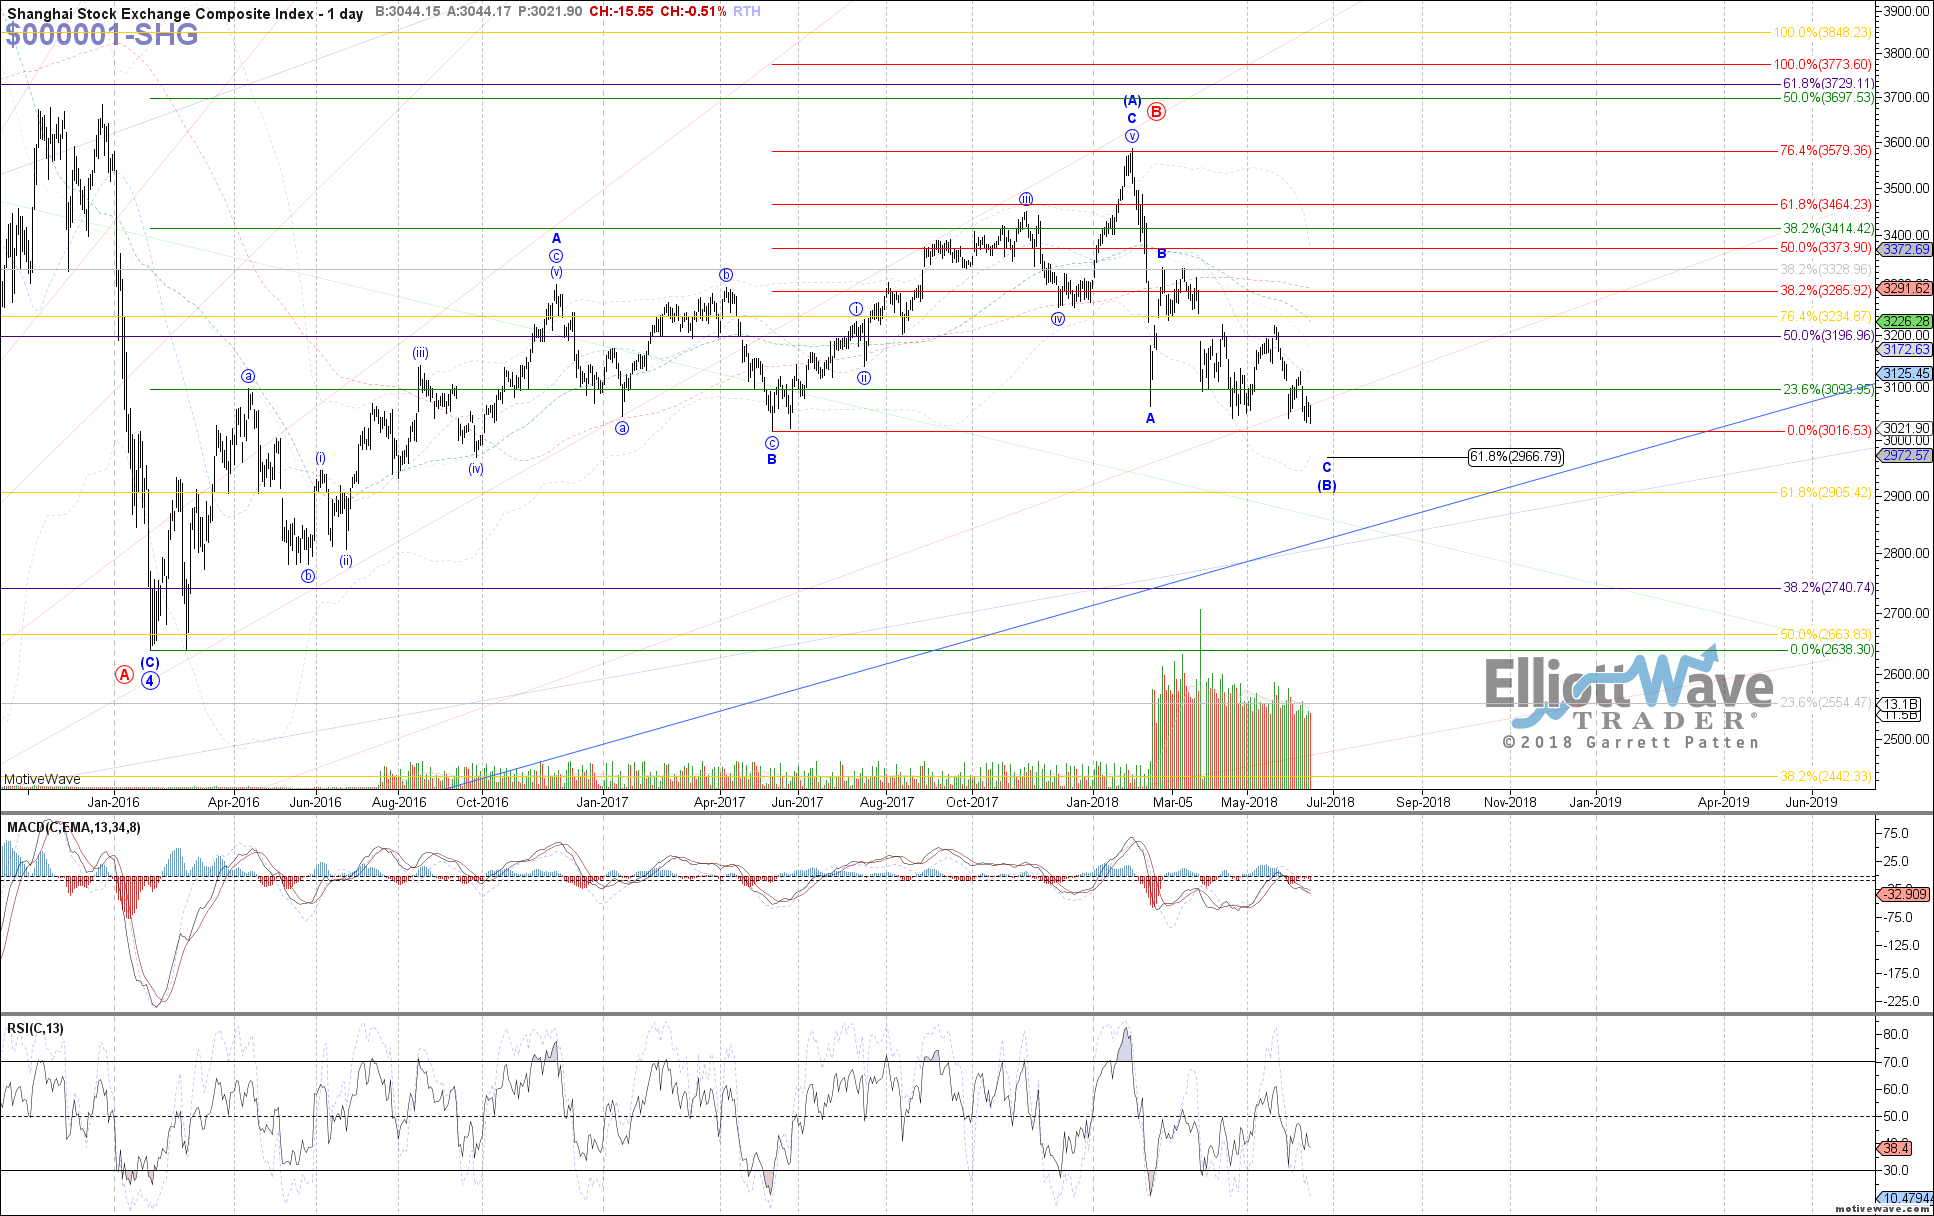
The Shanghai Composite (SSEC) traded lower overall last week as well, making a new low below the May low and so far following expectations as wave (c) of v. There is still room for more near-term downside before the ideal target is reached at 2950, so as long as price is below last week’s high it can still stretch lower. Otherwise, above last week’s high would be the initial indication that a bottom has already been struck.
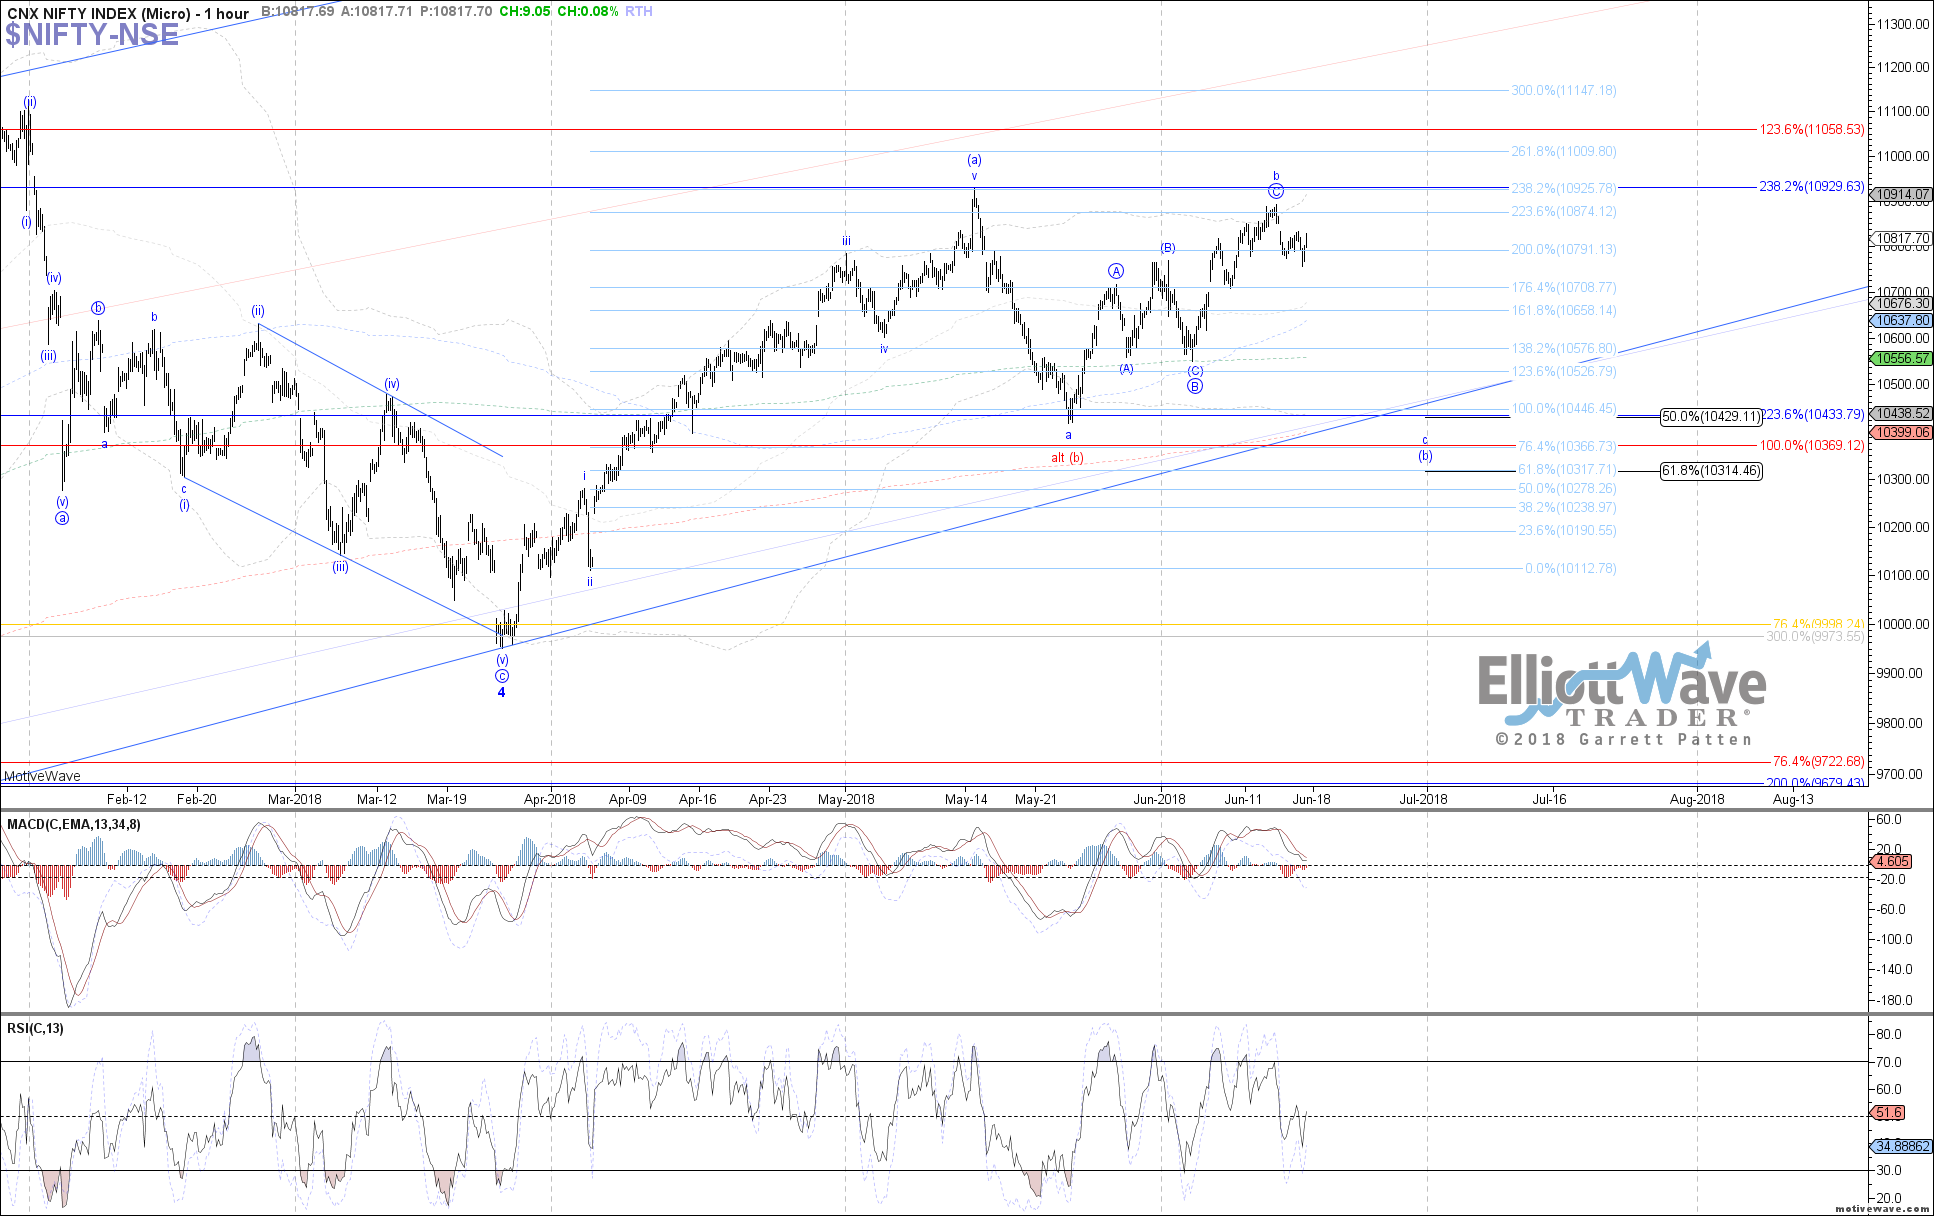
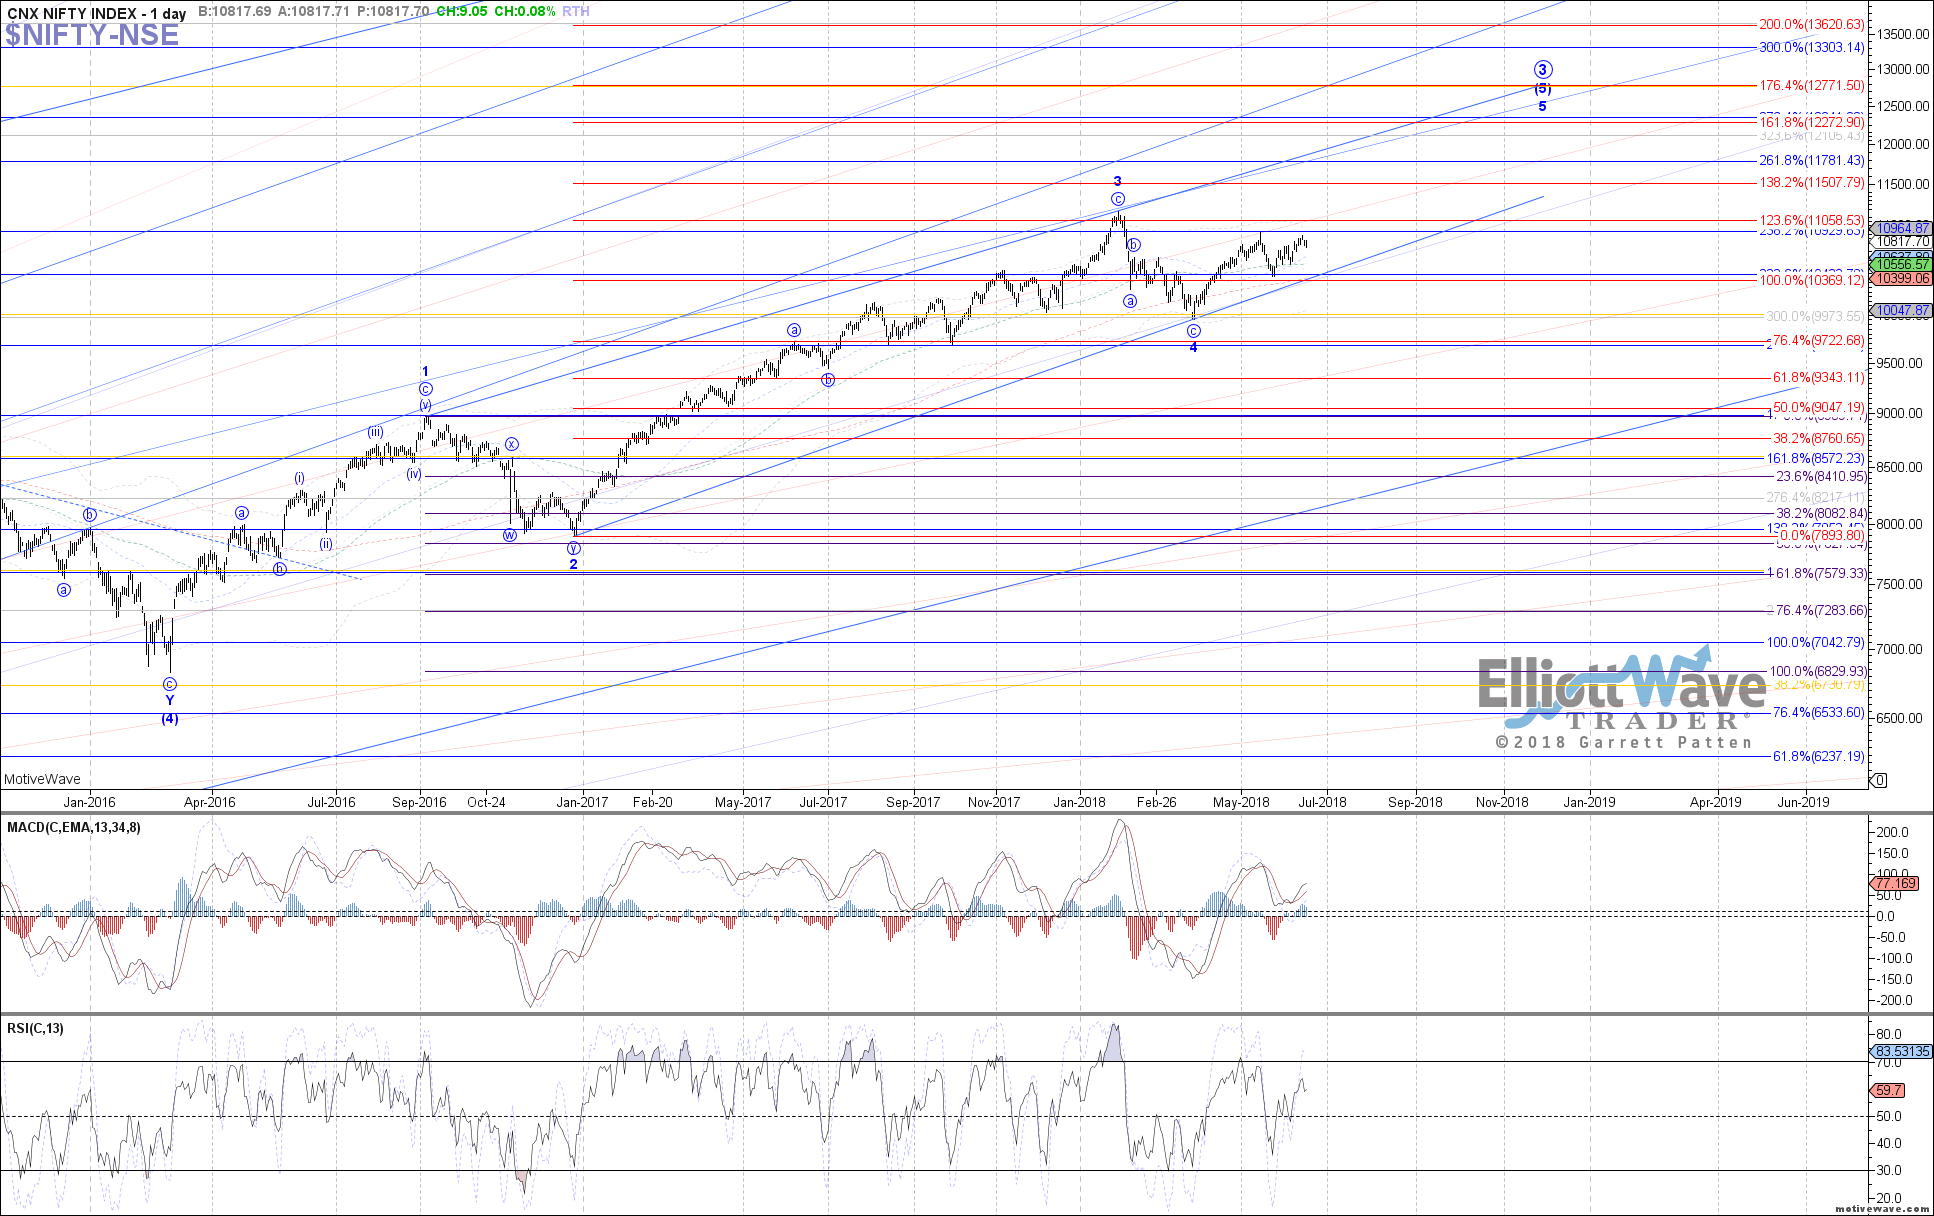
The Nifty (NSE) continued initially higher last week, coming close to retesting the prior May high before curling back down into Friday’s close. Under the blue count, last week’s high ideally completed wave b of (b) with price now turning back down as wave c of (b) and heading back toward the May low. Otherwise, a break back above the May high from here instead opens the door to a bottom already in place for all of wave (b) at the May low shown in red.
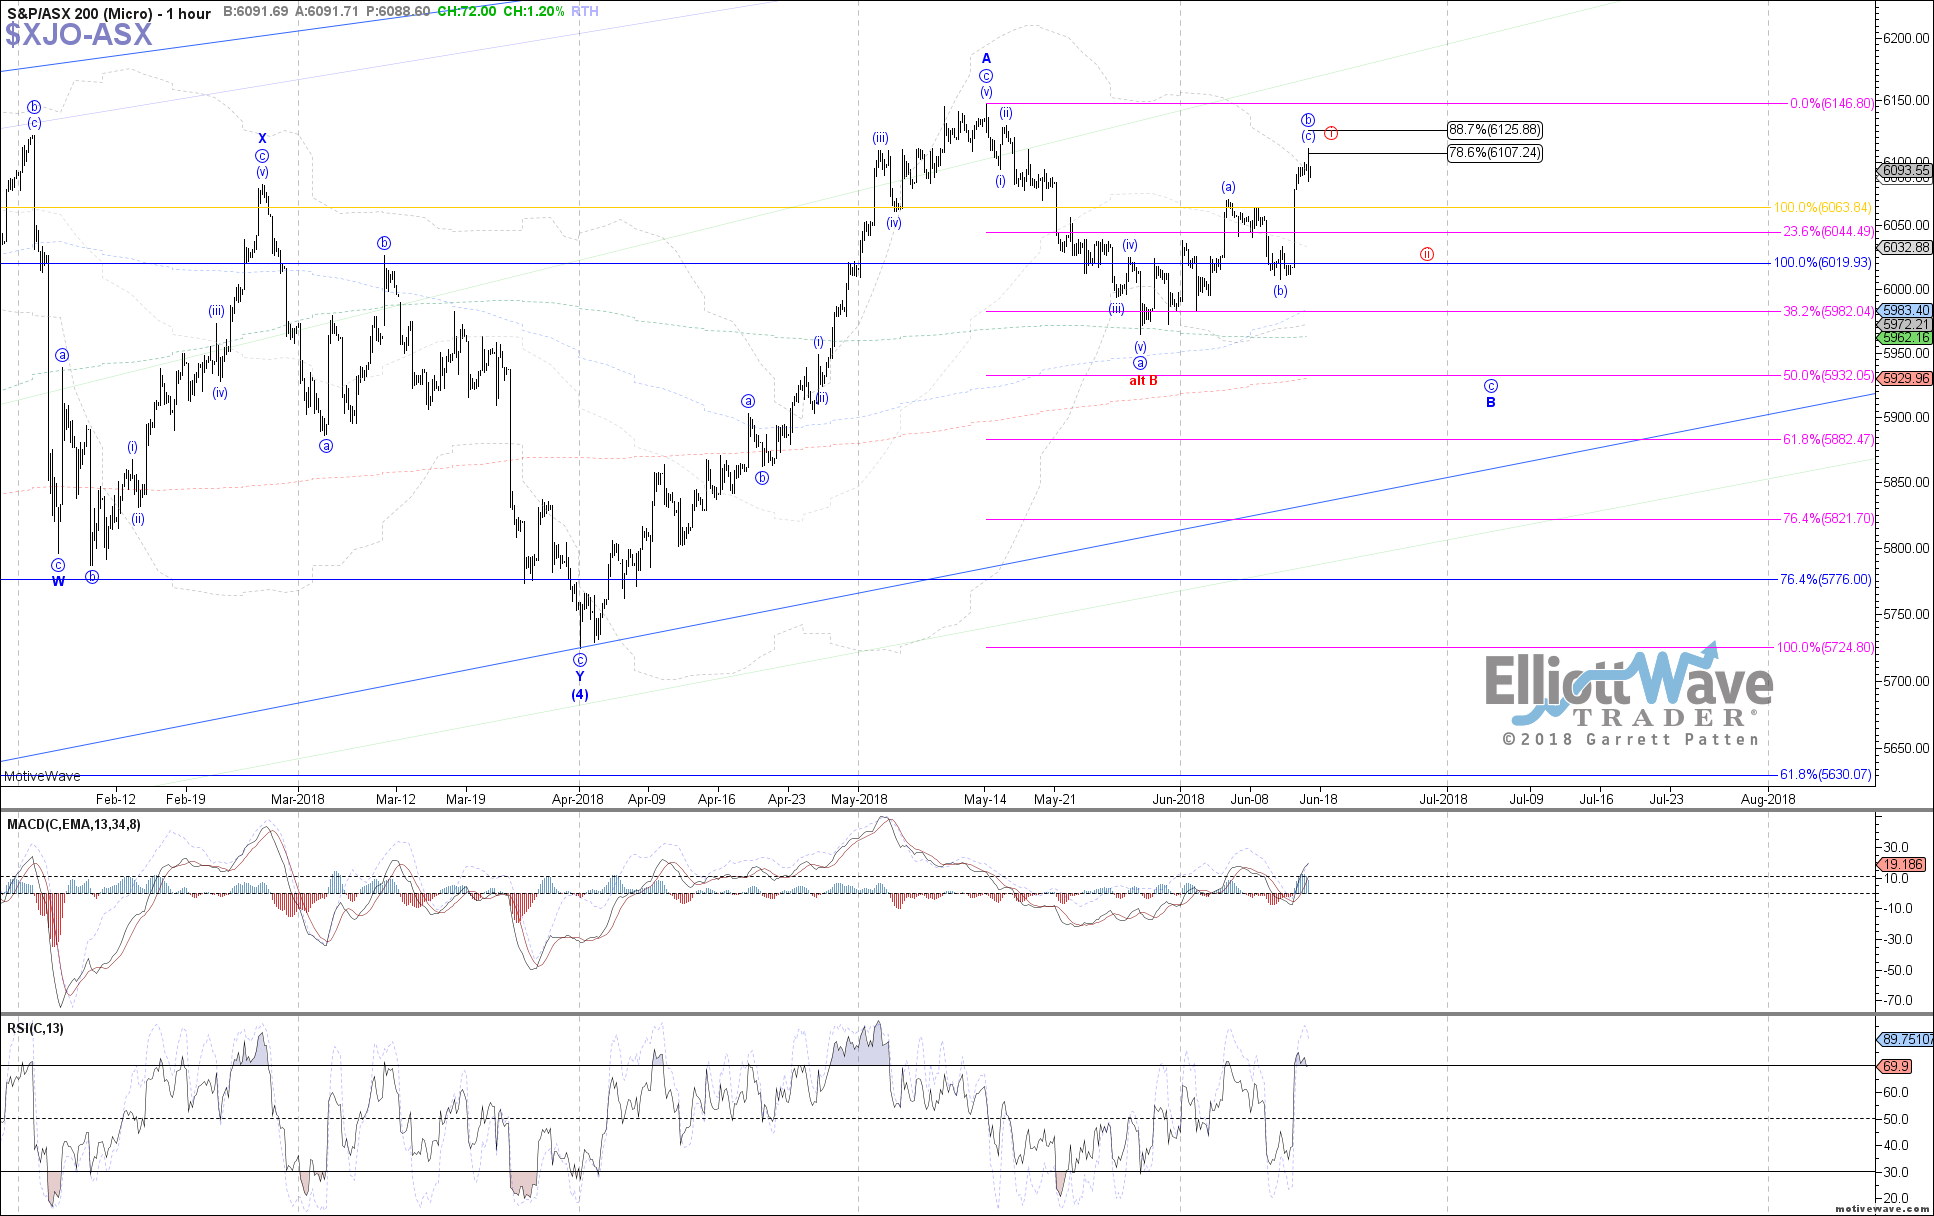
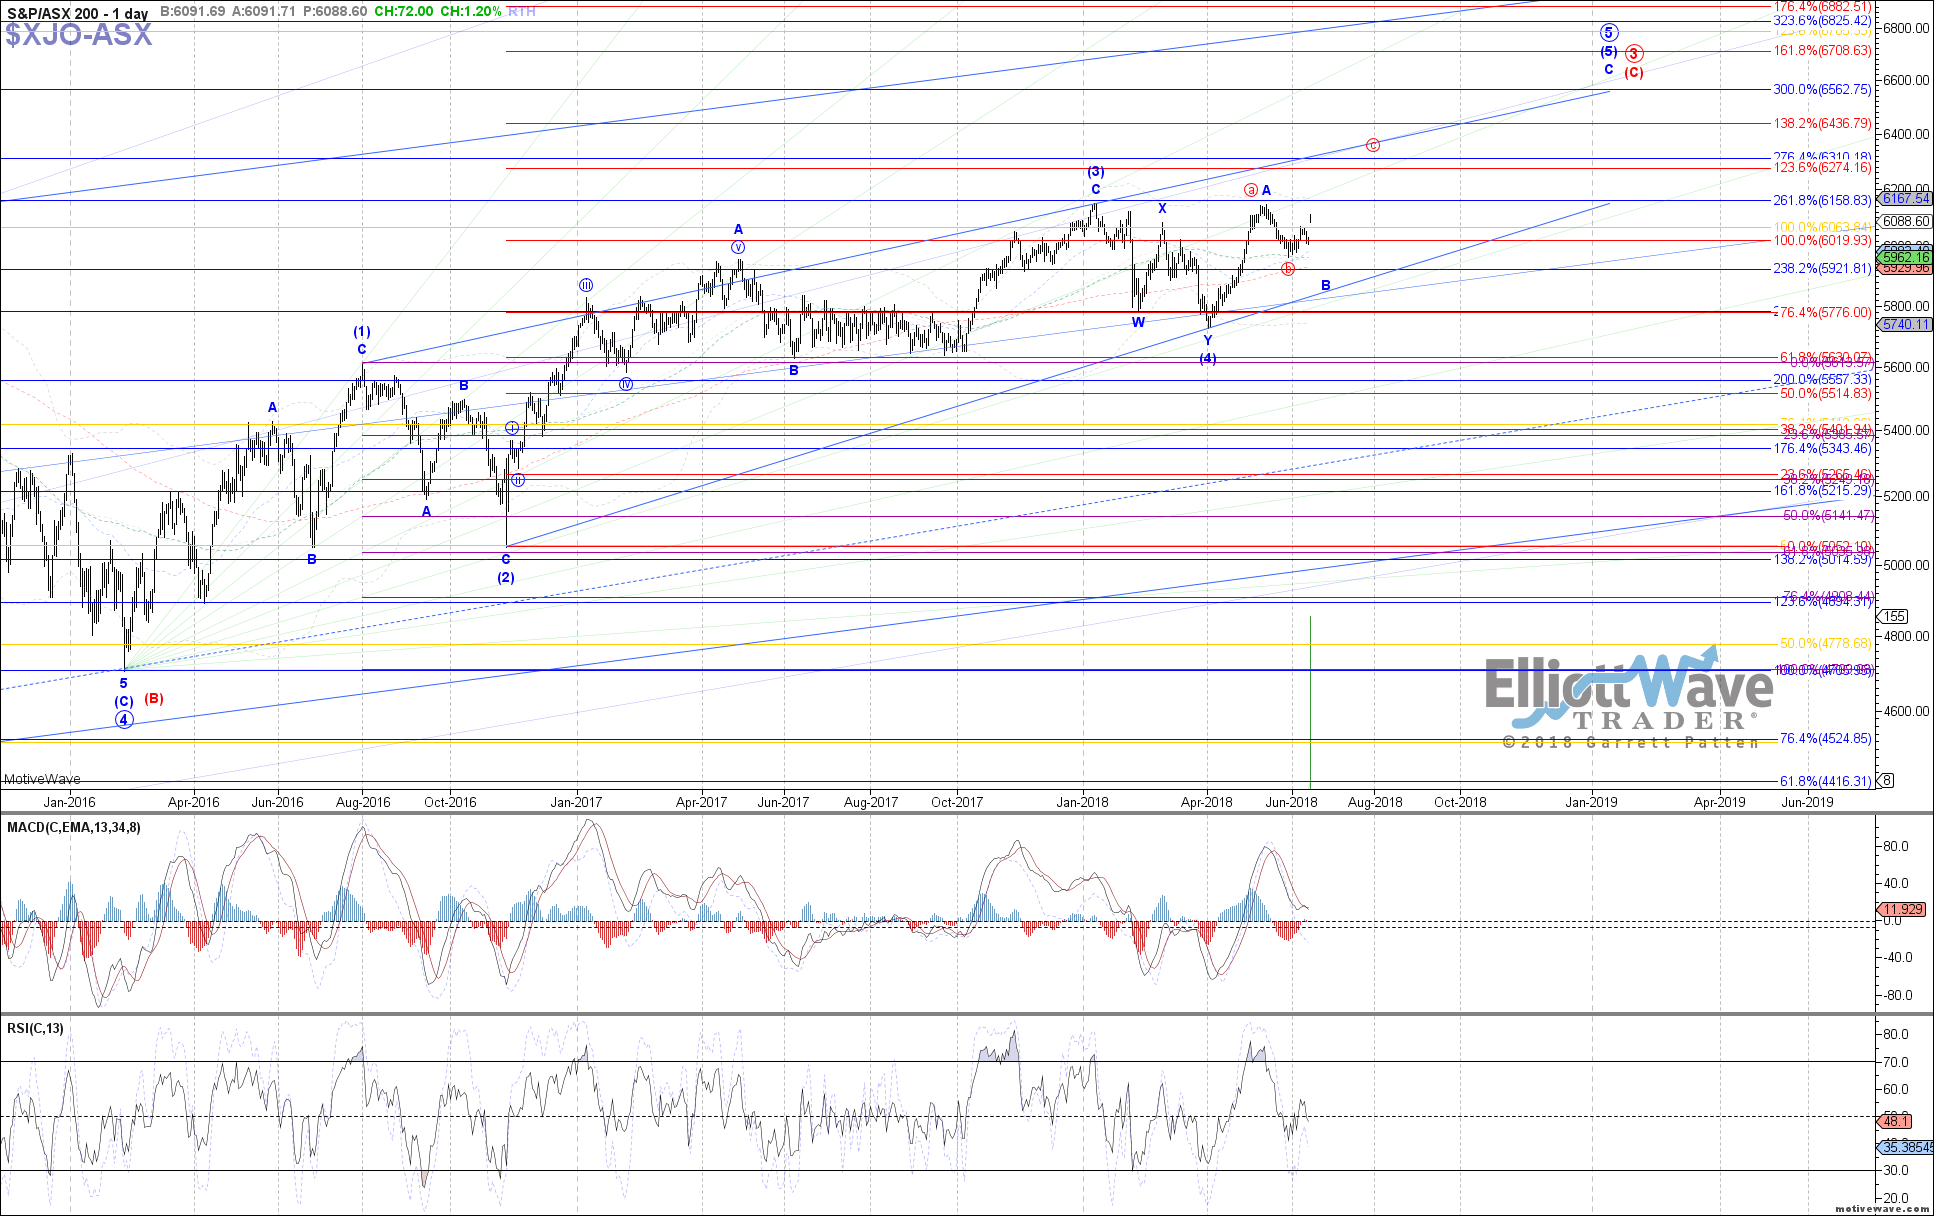
The ASX (XJO) traded strongly higher last week, allowing for a possible leading diagonal to be counted off the May low now and adding credence to the red count with a B-wave bottom already in place. Price would ideally pullback as wave ii of C next though, holding above 6000 and then taking out the May high. Otherwise, below 6000 puts odds back in favor of a retest of the May low under the blue count as wave c of a larger B-wave flat.