Market Analysis for May 30th, 2019
 By
By
On May 8th, I introduced two new systems I built called USOHL and GDXHL based on internals similar to NYHL1M. I wrote about them here - LINK - where I first introduced them... I also wrote about a short trade on USO in that thread.
Today in the Smart Money room, we booked that USO short trade for a nice 10.5% profit. Entry short was at 13.13$ and we closed it today at 11.75$. Full disclosure, I also had a GDX short on and I decided to close that also today for a loss of 1.4% since I did not feel the trade was worth the effort anymore. The USO short made up for the GDX short many times over... and that is what trading is all about.. big wins, small wins, and small losses... and make sure the small losses are paid for by the small wins.. and then big wins make up the chunk of your P&L. Avoid big losers at ANY cost....
SO.... What are market internals?
It is the breadth of the market... often times we focus a lot on an index SPX or NDX and forget that the index is made up of many stocks. Looking under the hood at different internal measures like advances vs declines, new highs vs new lows etc give us more clues on the overall health of the market. Summations, the mcclellan oscillator etc are different derivations from the basic advance decline data. I.E in a day how many stocks advanced over the previous day and how many declined - in the NYSE index. Because we have close to 3000 issues in there, the advance decline data rarely lies - it gives us clues of strength and weakness before the general index does.
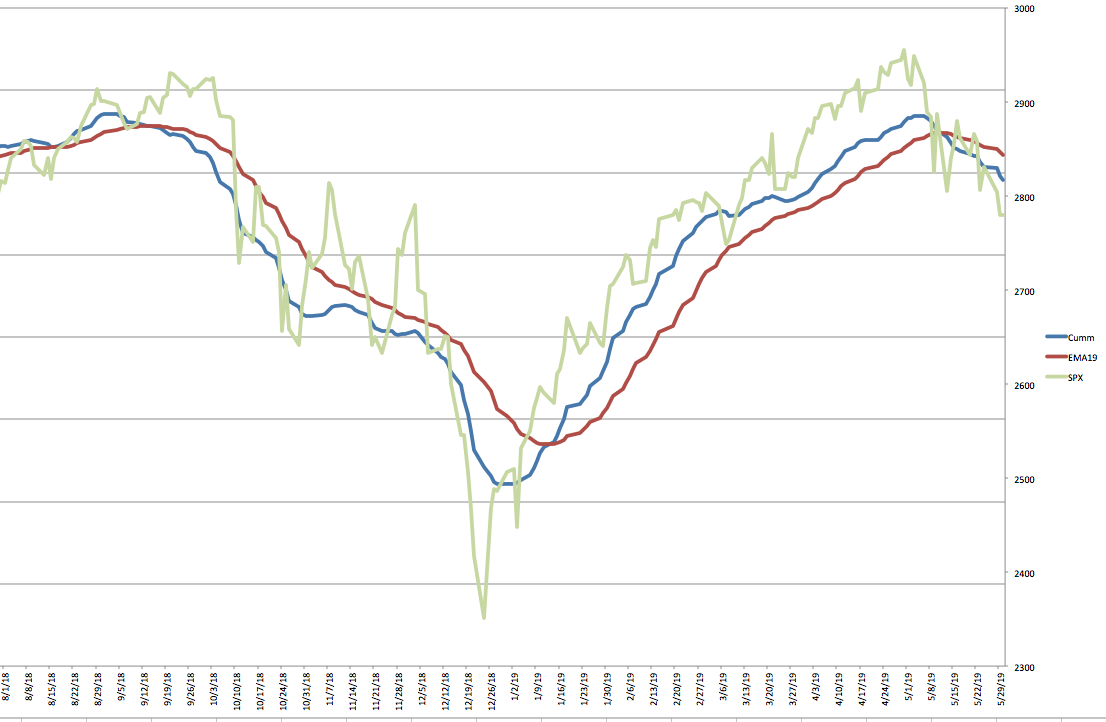
New high new low index is another internal measure. This is the new highs over a rolling 12 month period. I built the NYHL1M indicator using this principle but based on a 1 month period. New highs - new lows within a rolling 1 month period on a cumulative basis. Plot this against an EMA and you have a simple but very good trading system. This forms the crux of what I use in my trading decisions nowadays.
The NYHL1M went to a buy on Jan 14th this year at 2580 SPX/ES. It went to a sell few days back on 5/13 at 2834 SPX/ES... So the buy from Jan 14th captured close to 10% gains. Right now, we are on a sell signal and trades taken should be taken in the that context until we flip back to a buy. On the chart below, blue crossing above red is a buy and blue crossing below red is a sell... no confusion, no second guessing, just follow what the internals are saying.
Using this same principle, I built the GDXHL and USOHL systems.. These have been traded by me for a month now on a trial basis... the results of the first two trades (+10.5% on USO and -1.4% on GDX) are what I wrote about in the beginning of this post... Plan is to make this too official and part of the Smart Money room and add them to the trade signals and indicators presented there today....
Have a good evening all.
