Trading range breaks - Market Analysis for Aug 2nd, 2016
 By
By
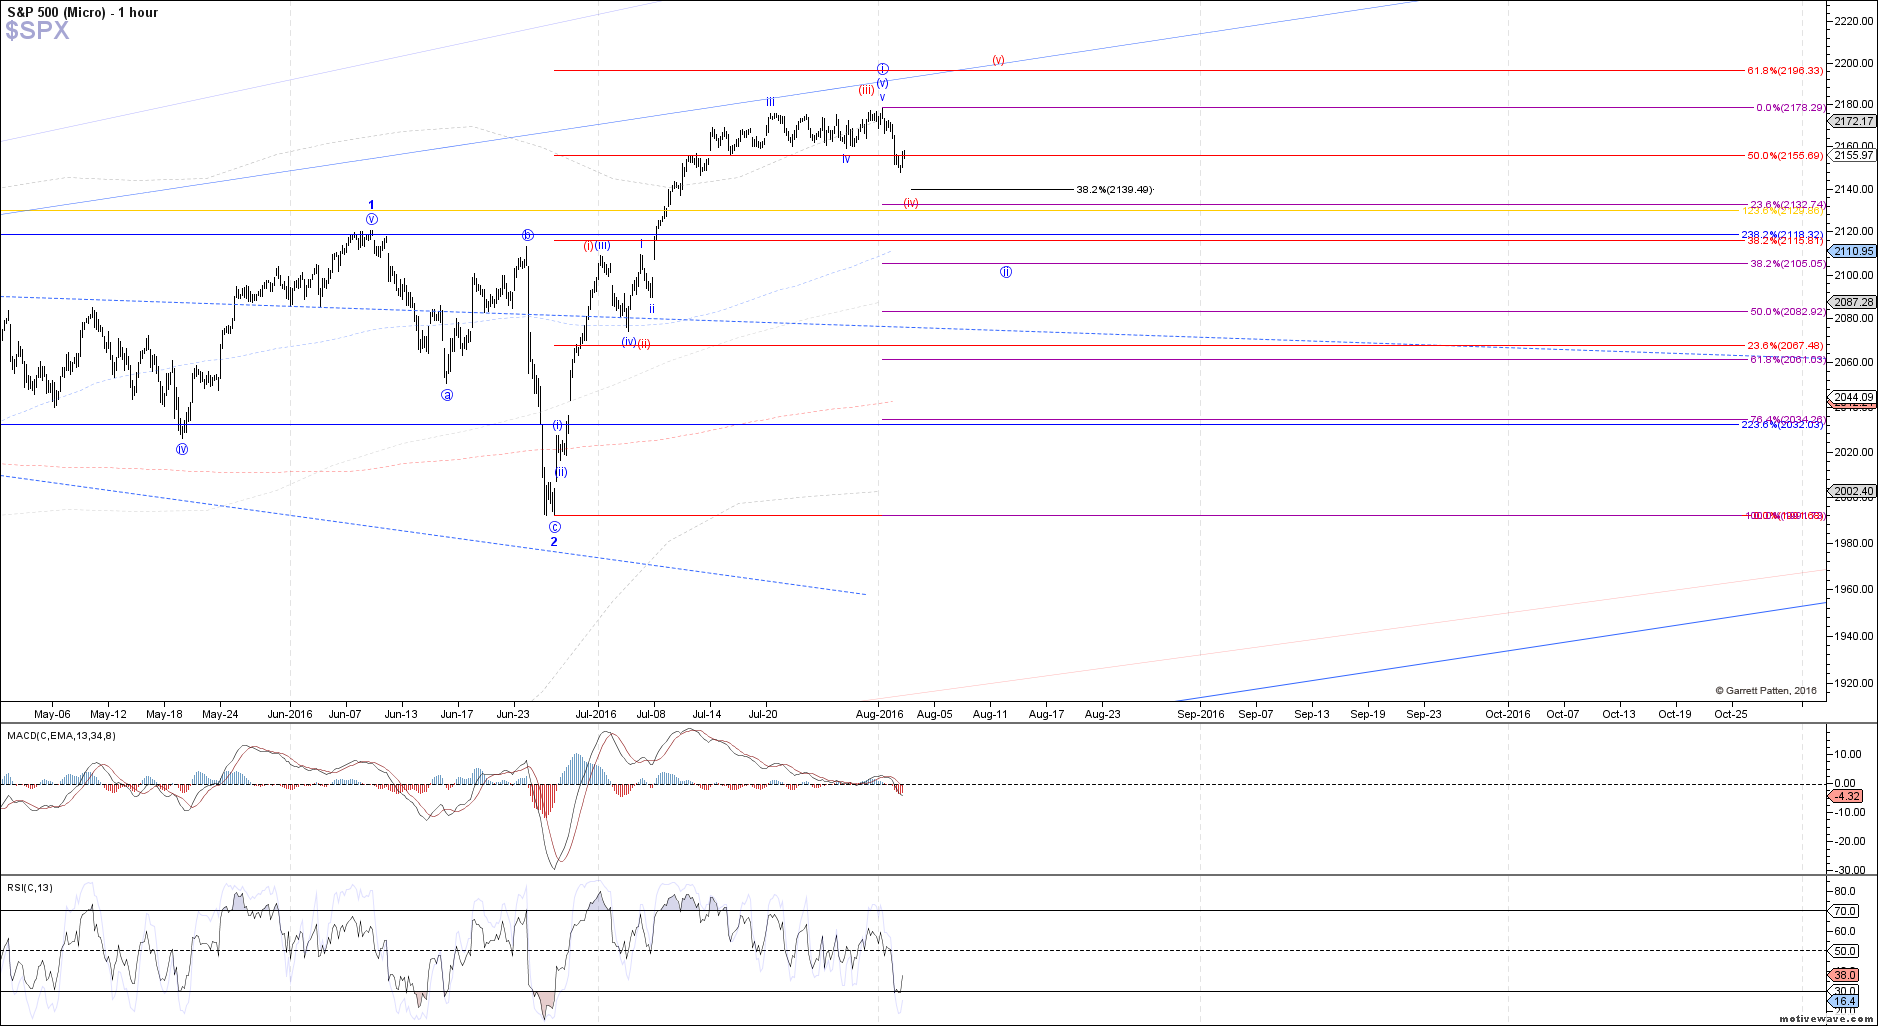
We finally saw a break today of the trading range that has formed over the past two weeks, with price falling below the 2158 SPX support cited. This action confirms a local top in place as either wave (v) of i in the blue count or wave (iii) of i in the red count.
Therefore, our two options for counting this pullback are as wave (iv) of a larger wave i shown in red, which should not trade below 2139 SPX to remain reasonable. This count would still allow for one more high into the .618 extension at 2195 SPX to complete wave i of 3 before getting another pullback in wave ii.
Otherwise, below 2139 SPX and odds will favor the blue count instead, where wave i of 3 has already topped and we are beginning a larger corrective pullback as wave ii of 3. Support for wave ii of 3 under the blue count is 2105 - 2061 SPX, the .382 - .618 retrace. For swing traders, that is the ideal region to start layering back into longs.