Tentatively looking lower - Market Analysis for Apr 1st, 2015
 By
By
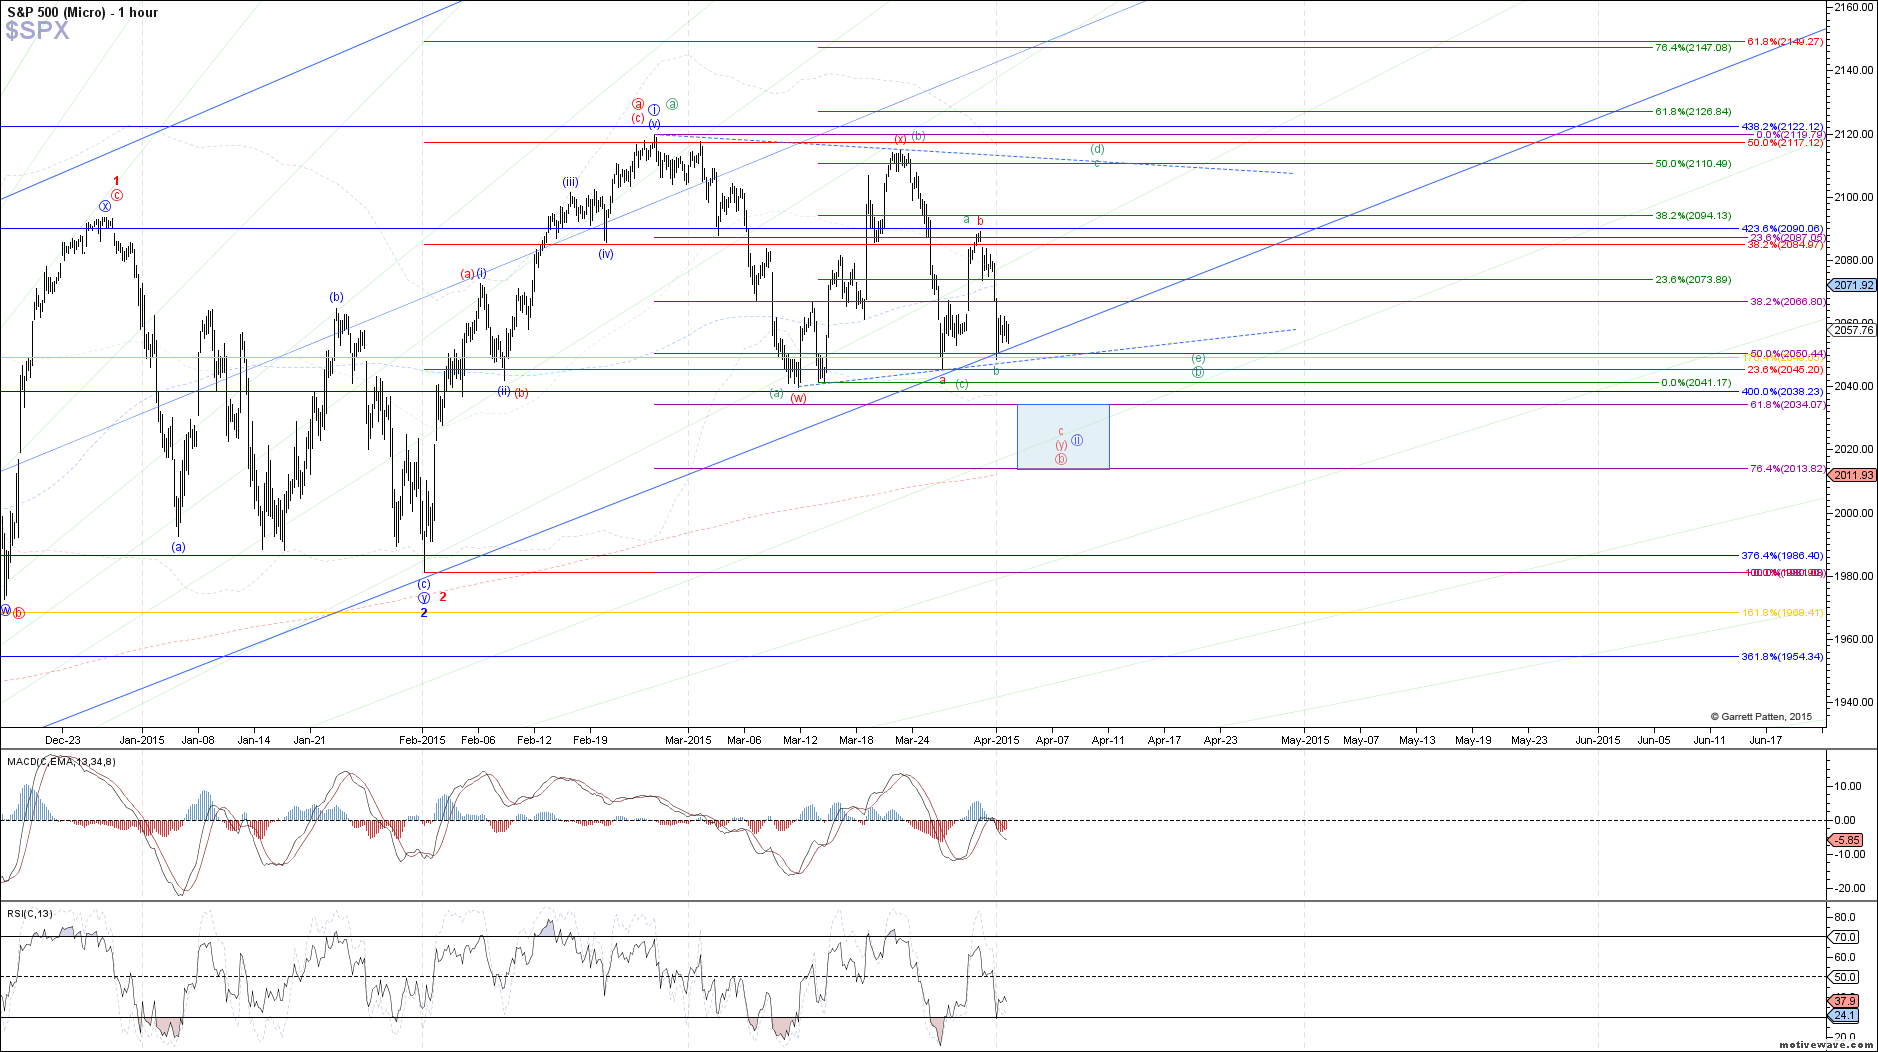
Last night, ES took a swift dive back to last week's low, following the expected path under the red count from yesterday's update. Since then however, price turned off the highway and started to take the scenic route, oscillating around in very messy looking corrective structures. This is suggestive of an ending diagonal at play for the 5th wave of c in the red count, which means that we should still see price undercut the March lows slightly before a bottom (target is 2034 - 2014 SPX), but the path taking price there may be very messy and difficult to trade.
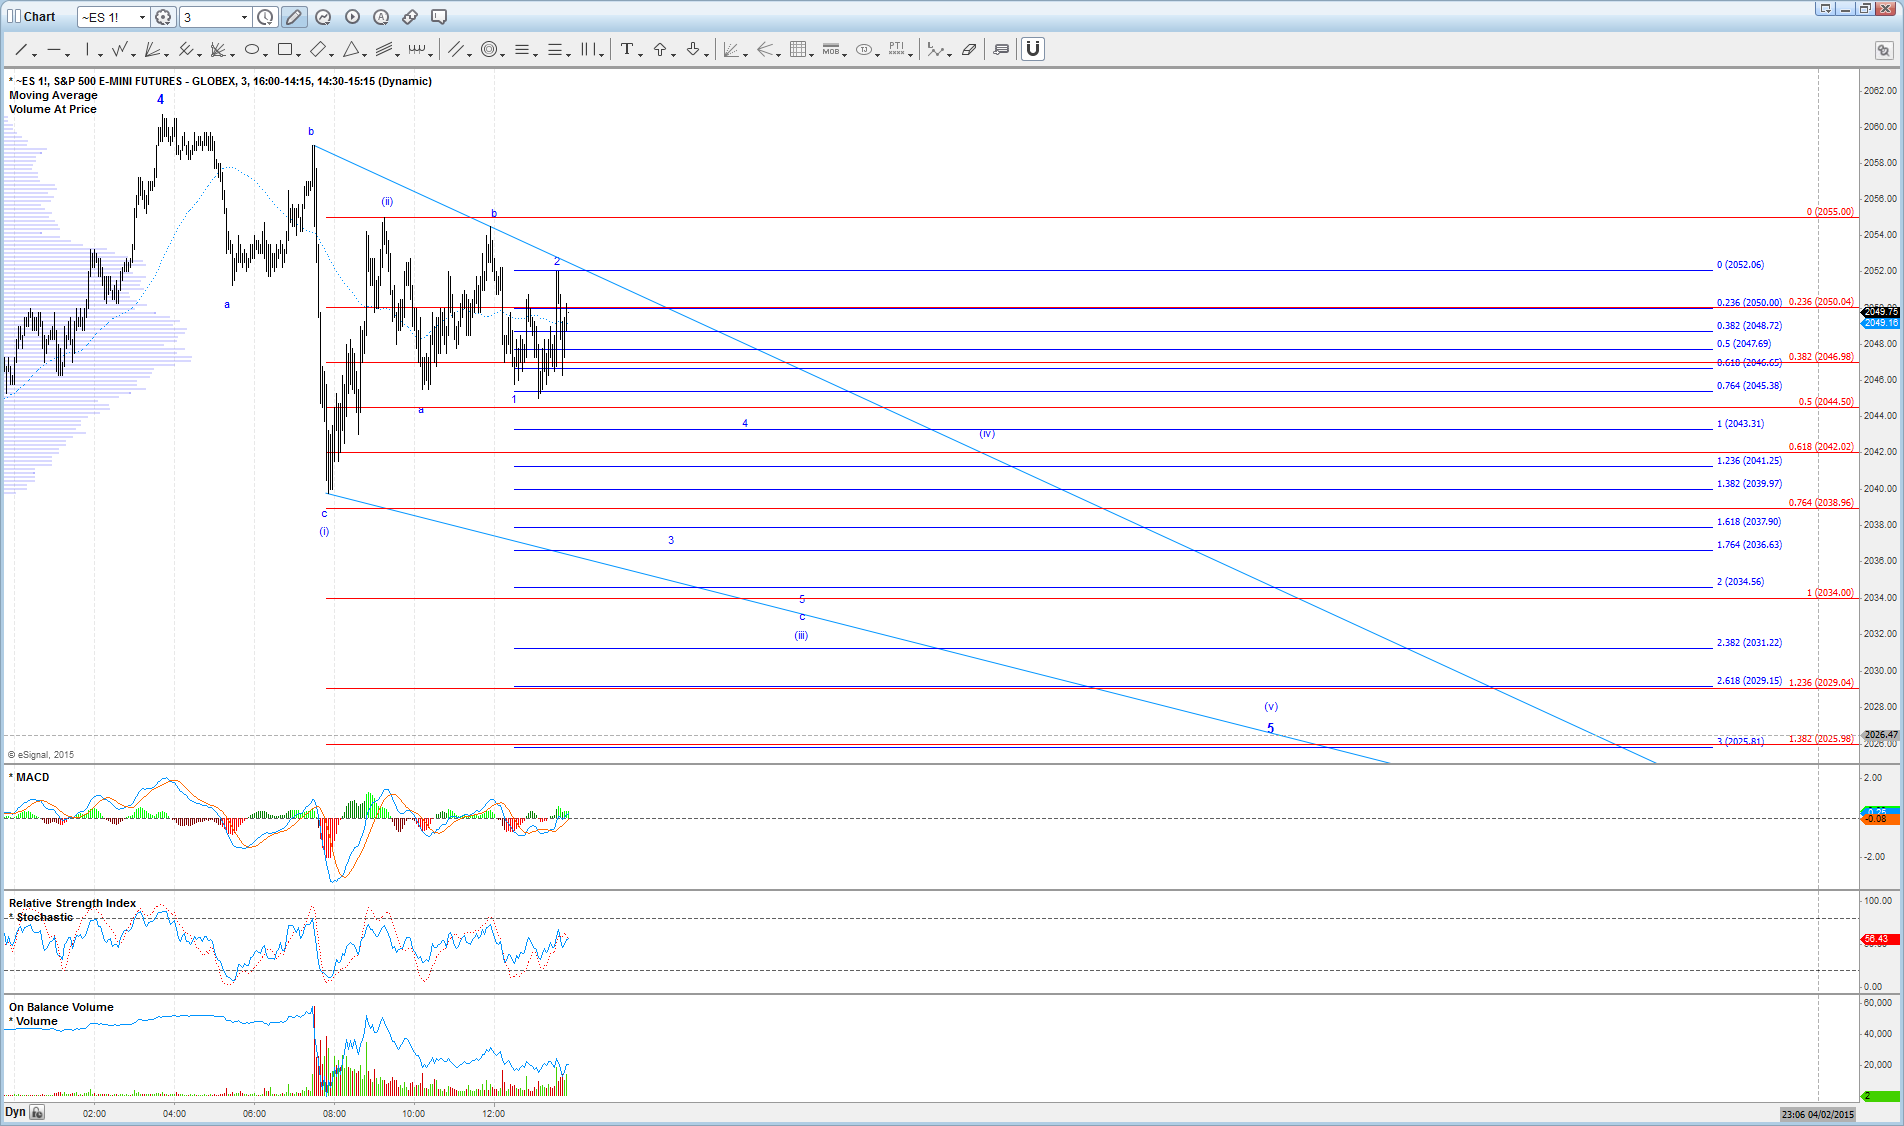
A tentative path for the potential ending diagonal structure for wave 5 of c has been provided on the 3 min ES chart below, but please understand that this path is subject to change or invalidation given the variability and complexity often associated with diagonal structures. If price were to break back above 2055 ES from here, it would suggest that wave 4 of c is not complete yet.
Overall, it appears that we are on course to complete a bottom sometime next week, assuming the red count continues to remain operative. Do keep in mind that the b-wave triangle in the green count has not invalidated yet though, which can burn up another month of option premium, but currently it looks much less likely than the red count unless price were to reclaim and hold above the 50 day SMA from here.