Picture still murky - Market Analysis for Oct 16th, 2013
 By
By
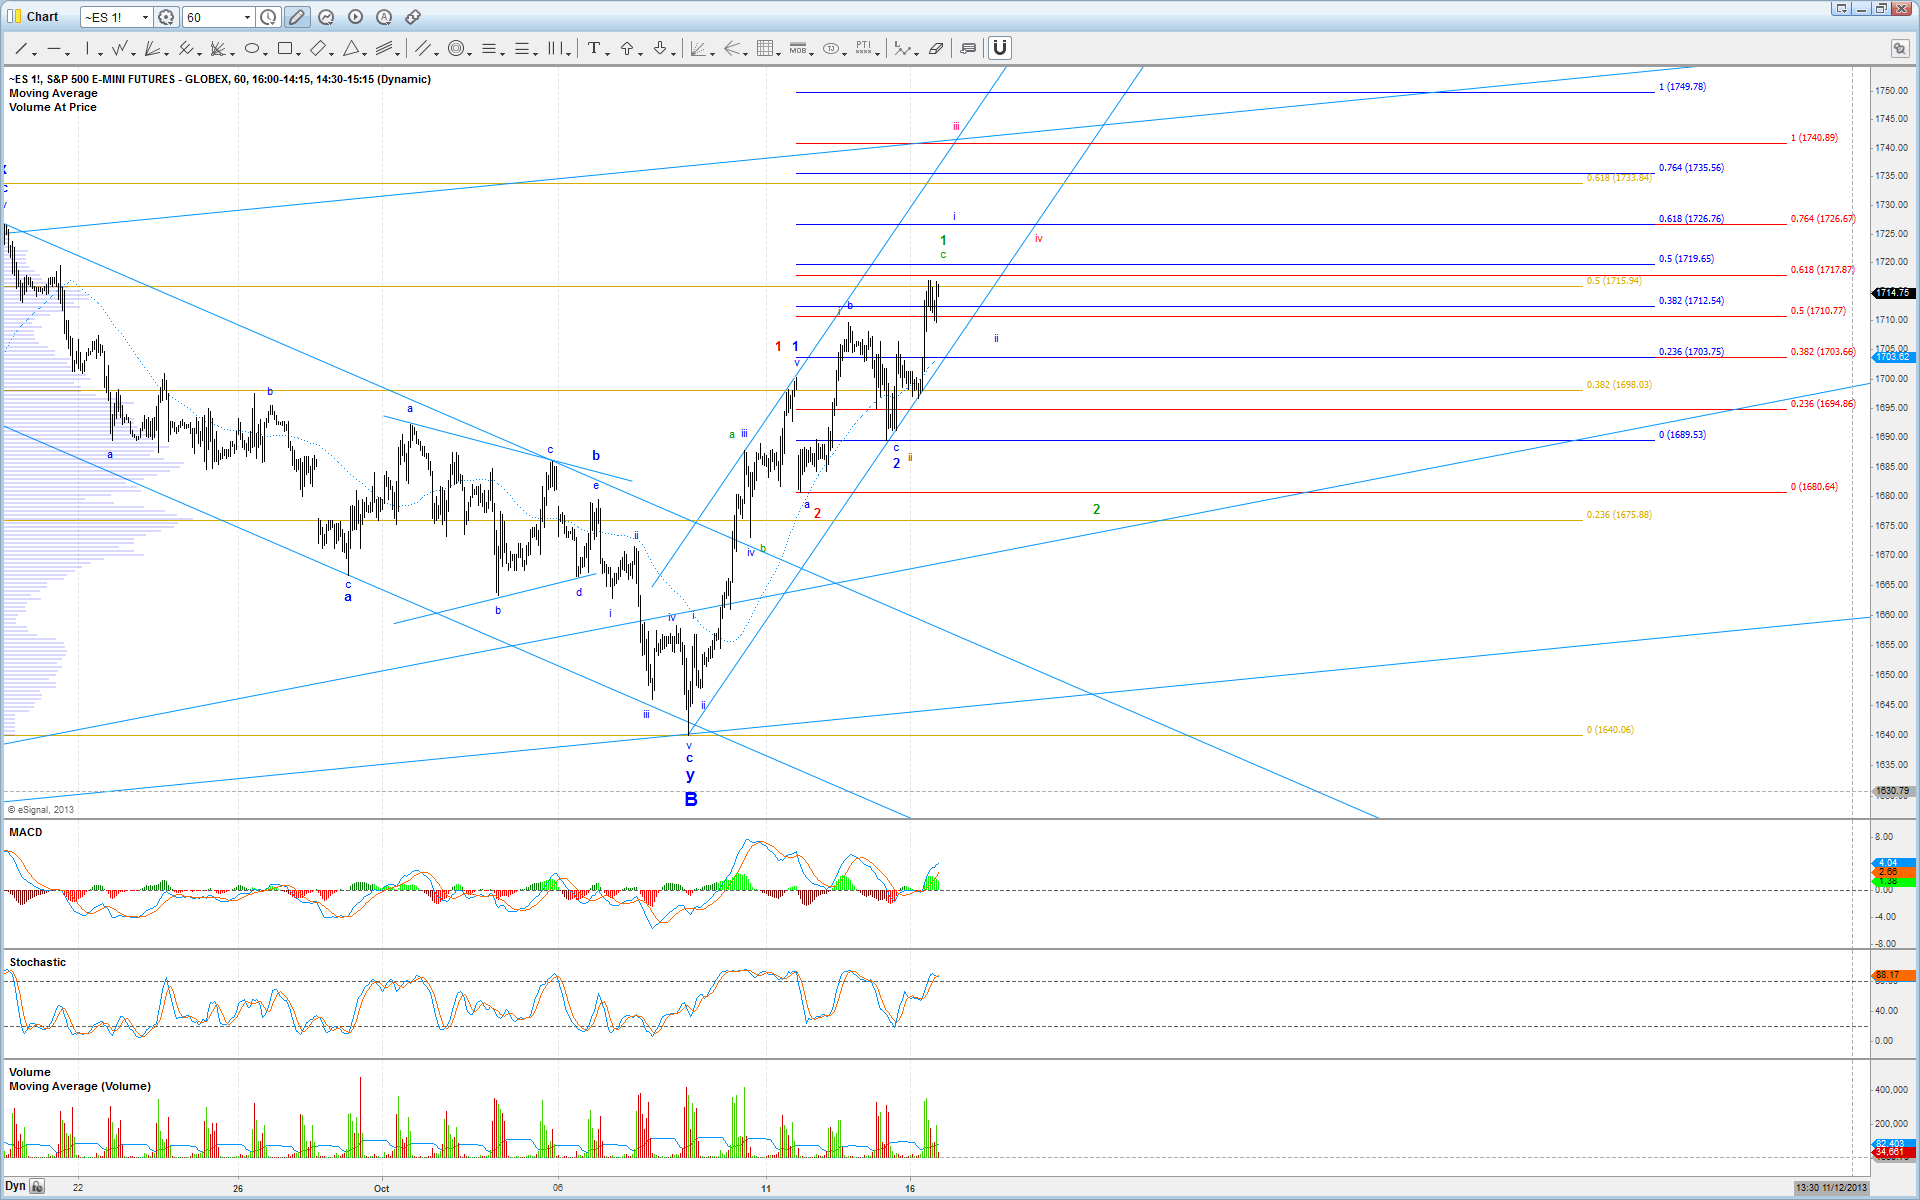
Even with the spike up early today, which eventually breached the 1714 resistance that we were watching, very little clarity has been brought to the ES chart. In fact, I have added a 3rd count to the chart in green, which I hate to do (I always try to focus on only the 2 most probably outcomes that I see), simply because the probabilities of all three counts are close enough to warrant tracking. The red and blue counts should be familiar if you have been following the recent updates sent out, but here is a quick summary:
The red count places price in wave iii of 3, and should be targeting 1741 in the next few days. Falling below 1708 is the first signal of a breakdown.
The blue count places price in wave i of 3, which should target 1727 before the end of the week, followed by a wave ii pullback that holds 1700. Falling below 1708 before hitting 1727 is the initial signal of a breakdown.
The green count suggests that price is topping in wave c of 1 in a larger ending diagonal. The c-wave should stay below 1721. After completing, this count would lead to a larger 3 wave retrace targeting 1690 - 1670, which would then setup the next leg higher of the ED in 3 waves as wave 3.
So, at this time, 1708 is an important support level to watch, which if breached could lead to a more substantial pullback. Otherwise, as long is price is above this level and inside the trend channel from the 1640 low, expect higher levels to come sooner rather than later.