No bottom confirmed yet, but the door has at least been opened
 By
By
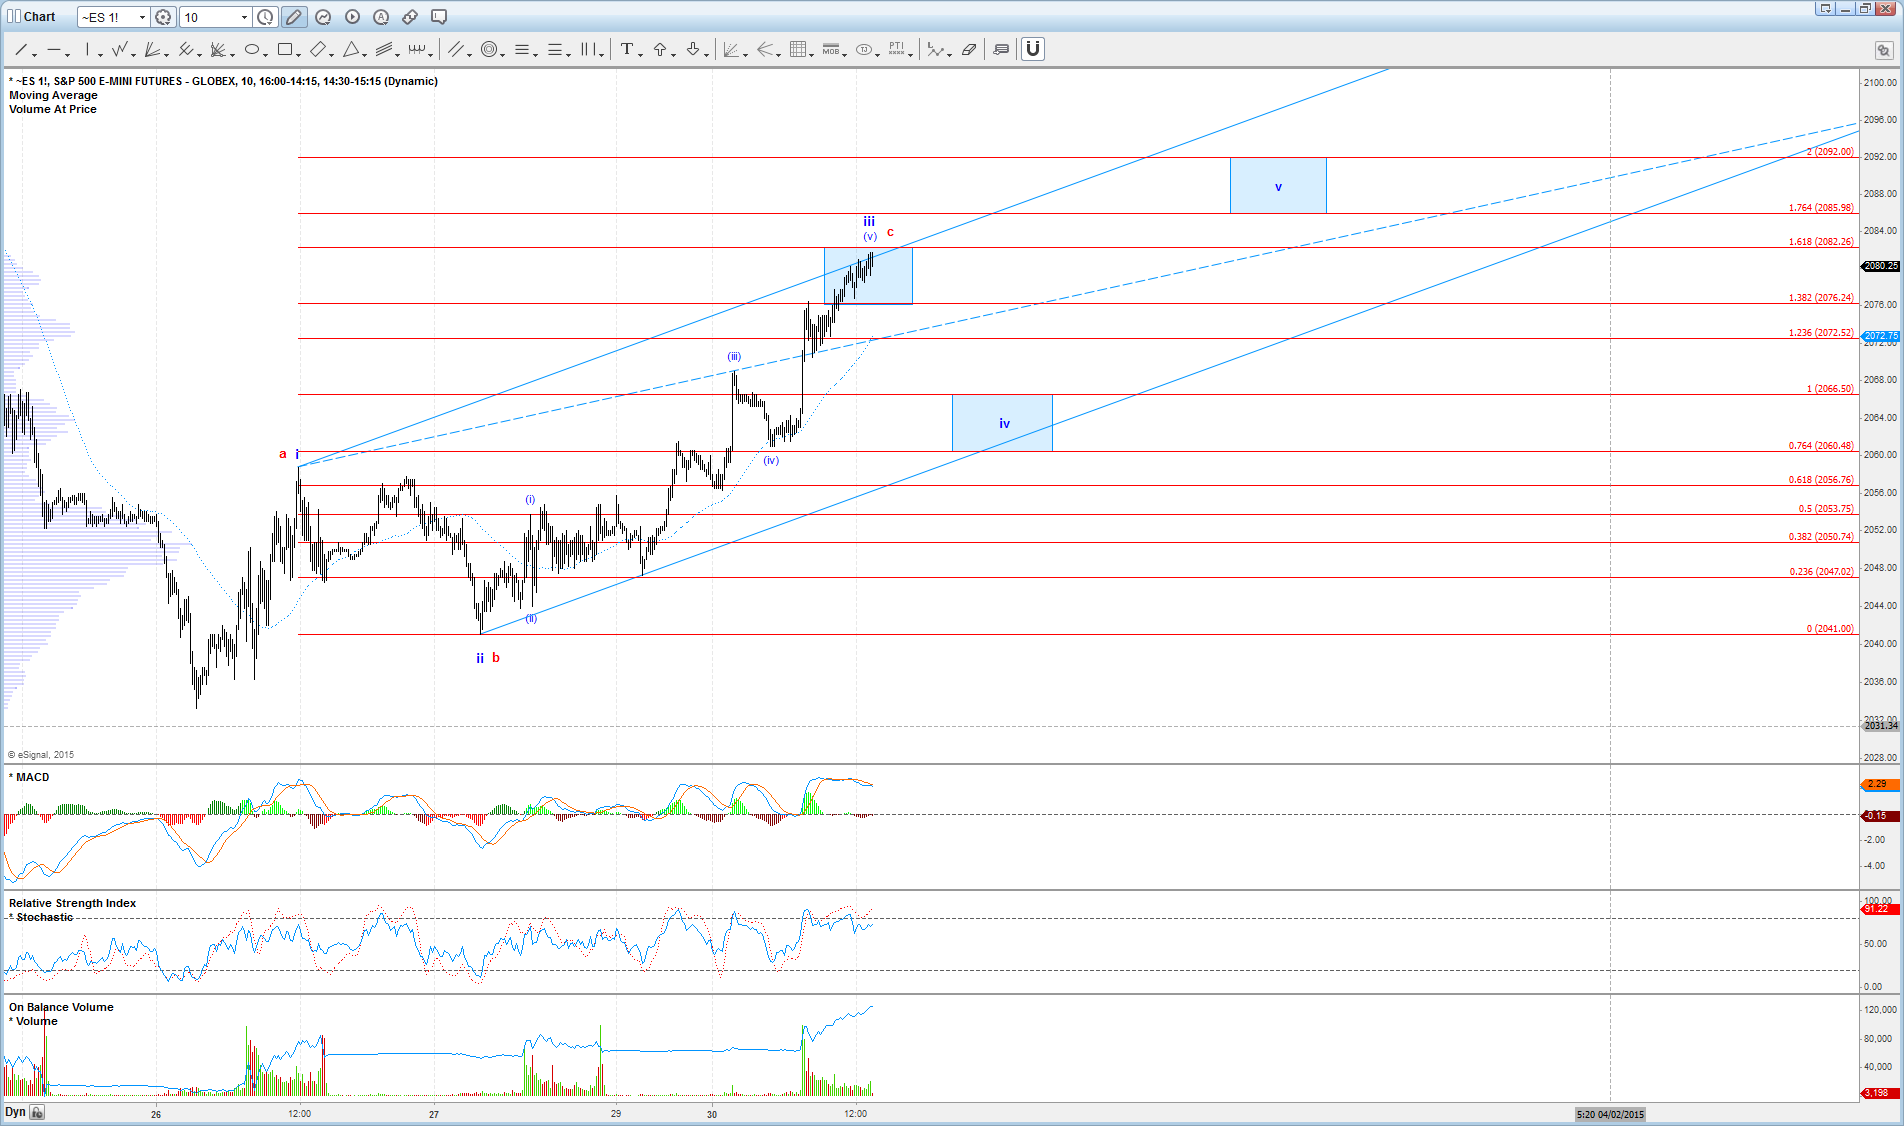
With the "gap and go" move today in equity markets that has now carried price above resistance that should have held for a corrective 4th wave in Avi's yellow count from the weekend update, it would be remiss of me not to at least consider that a bottom has been put in already. However, in order to confirm such a scenario, we need to see a full five waves complete off last week's low, otherwise there are still possible interpretations that can lead to one more low.
On the 10 min ES chart attached below, I have illustrated both the bullish and bearish interpretations of this structure off last week's low. In the bullish interpretation, price would have completed wave iii today, and now needs a pullback as wave iv followed by another high in wave v to complete a full five waves up to confirm a bottom. Price would need to hold between 2066.50 - 2060.50 ES as blue wave iv to maintain this count as probable.
Otherwise, a break below 2060.50 ES shifts probabilities in favor of the bearish red count, in which this rally was only a corrective 3 waves off last week's low, with today's high likely completing wave c. The bearish scenario should develop a micro 5 waves down off this high in order to suggest that a new low below the one made last week is imminent. The same targets below from Avi's weekend update would still apply in this scenario.
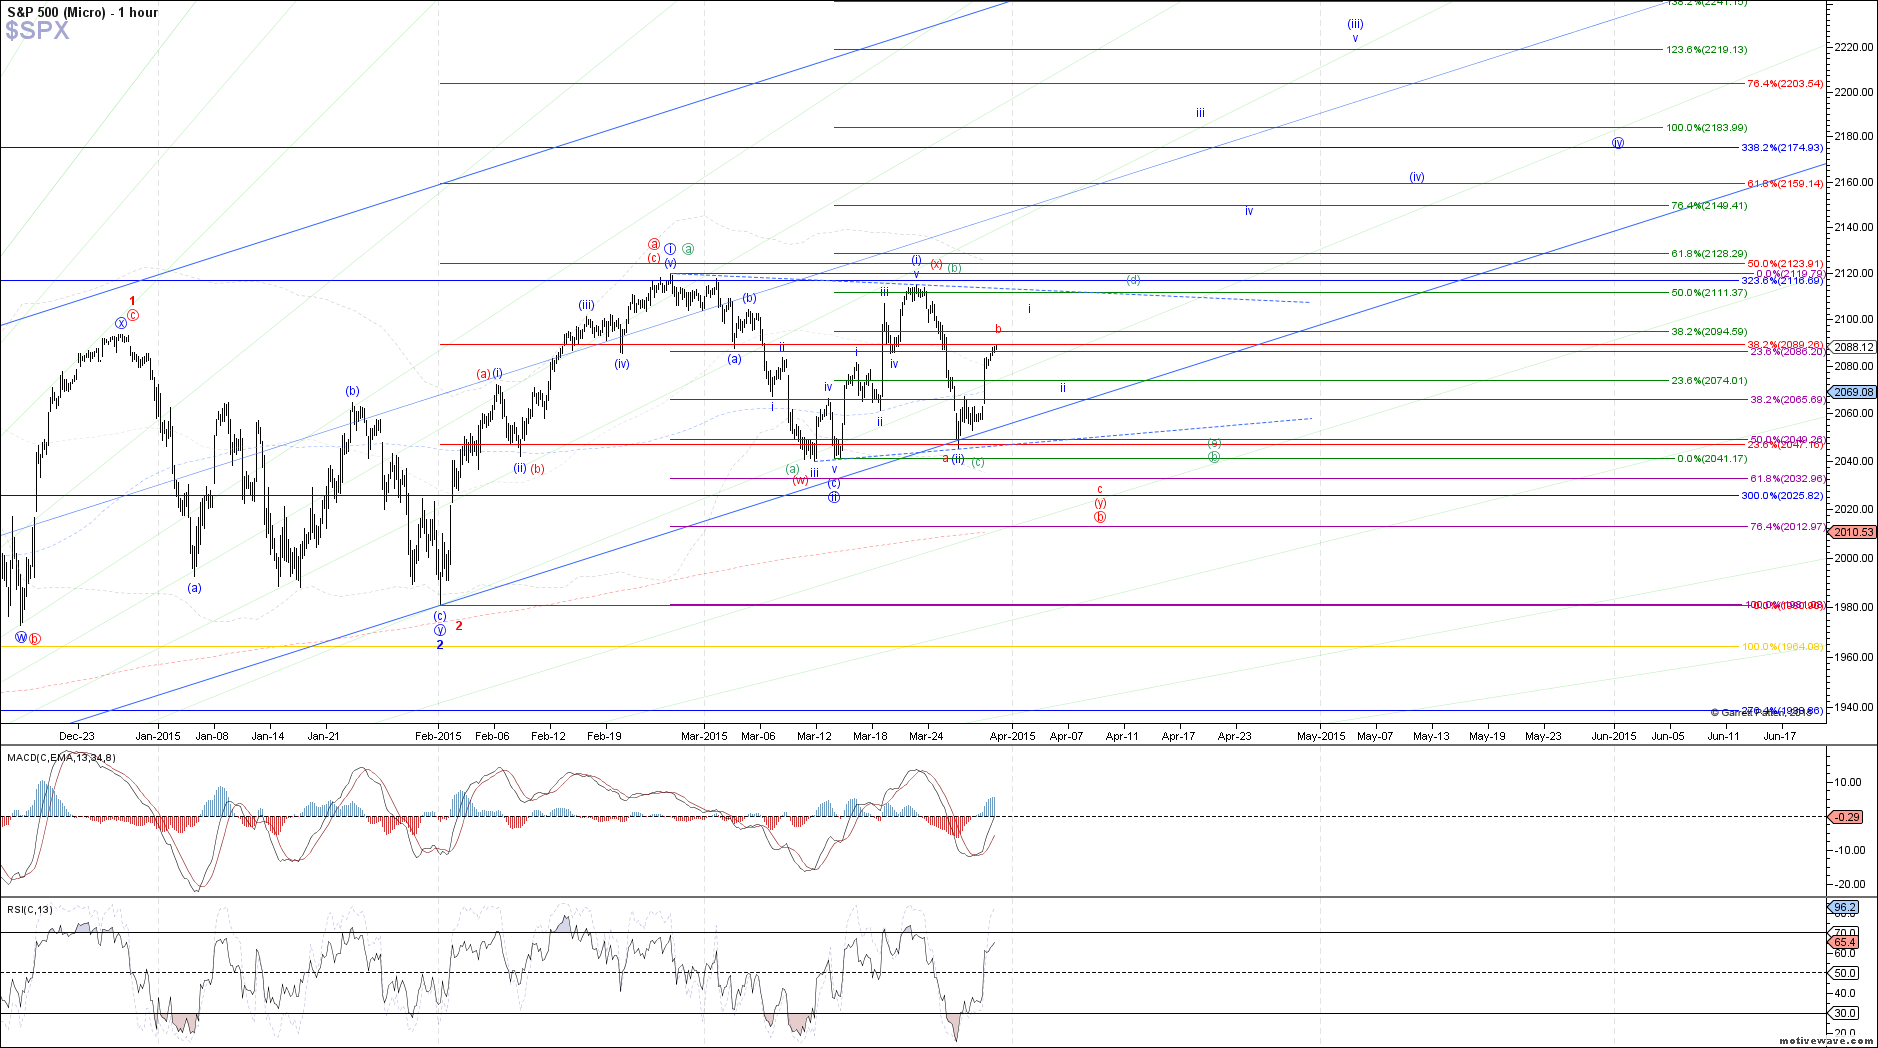
Finally, and I apologize for making things a little more confusing by adding a 3rd count, there is one more possibility that I have added to my hourly SPX chart, which is a b-wave triangle shown by the green labels. This would allow for more upside from here that carries price close to last week's high without breaking above it as wave (d), and still leading to a sharp decline that would come close to reaching last week's low again in wave (e).