No Indication Pullback is Complete Yet
 By
By
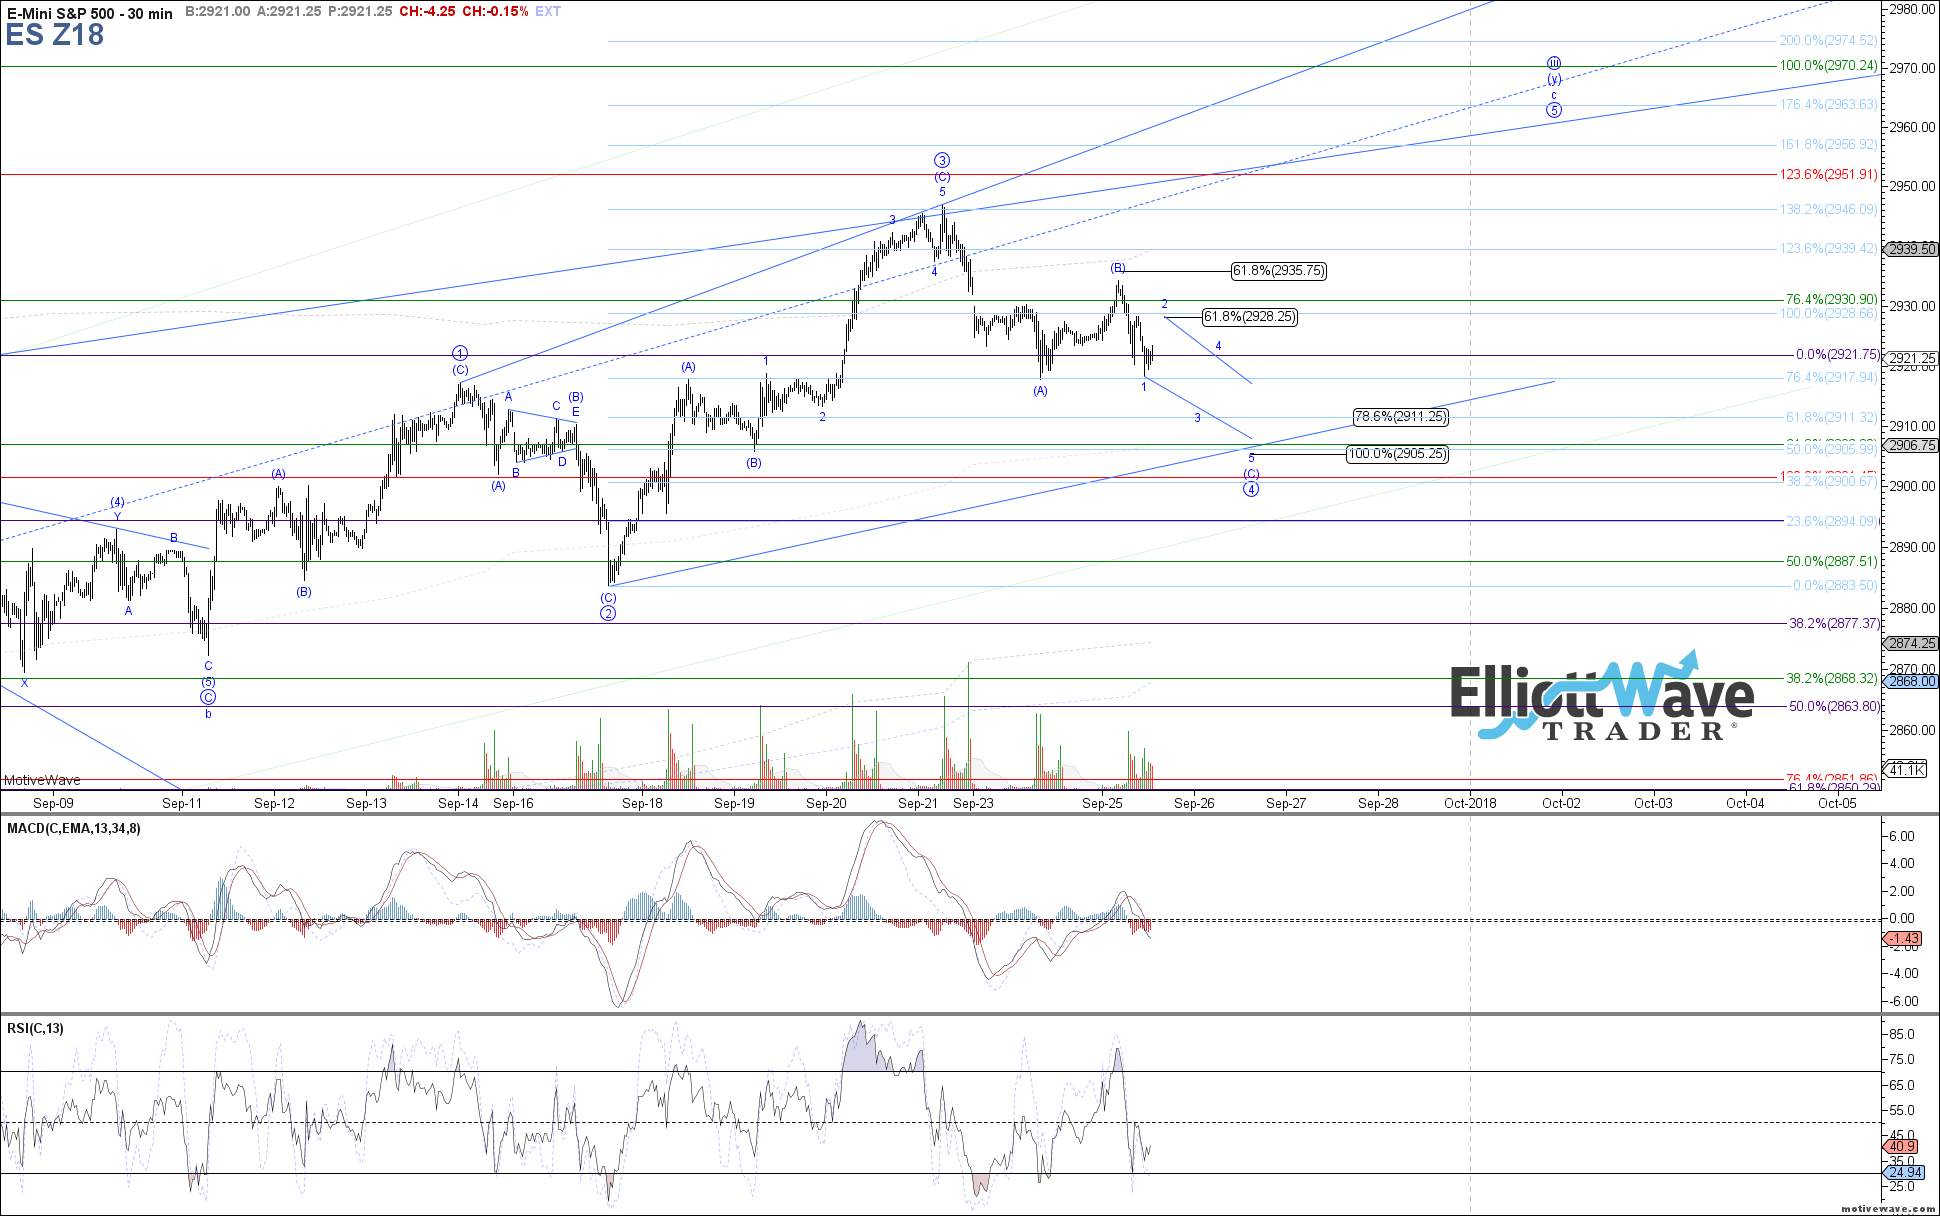
The market continued lower after the open today, following the red path presented this morning as a potential (C)-wave down in progress off the pre-market high. So far price has retested the low made yesterday and is attempting to bounce, but until a break back above the pre-market high is seen, I can't place faith behind anything immediately bullish yet.
If the pre-market high at 2934.25 in the Emini S&P 500 (ES) did indeed complete a (B)-wave bounce, then 2911 - 2905 would be the likely target support that should be reached before wave (C) completes, with a possible 1-2 start to an ending diagonal forming. That would continue to keep price within the limits of being wave 4 of the larger ending diagonal off the September low, to still setup one more high as a 5th before a more significant top.
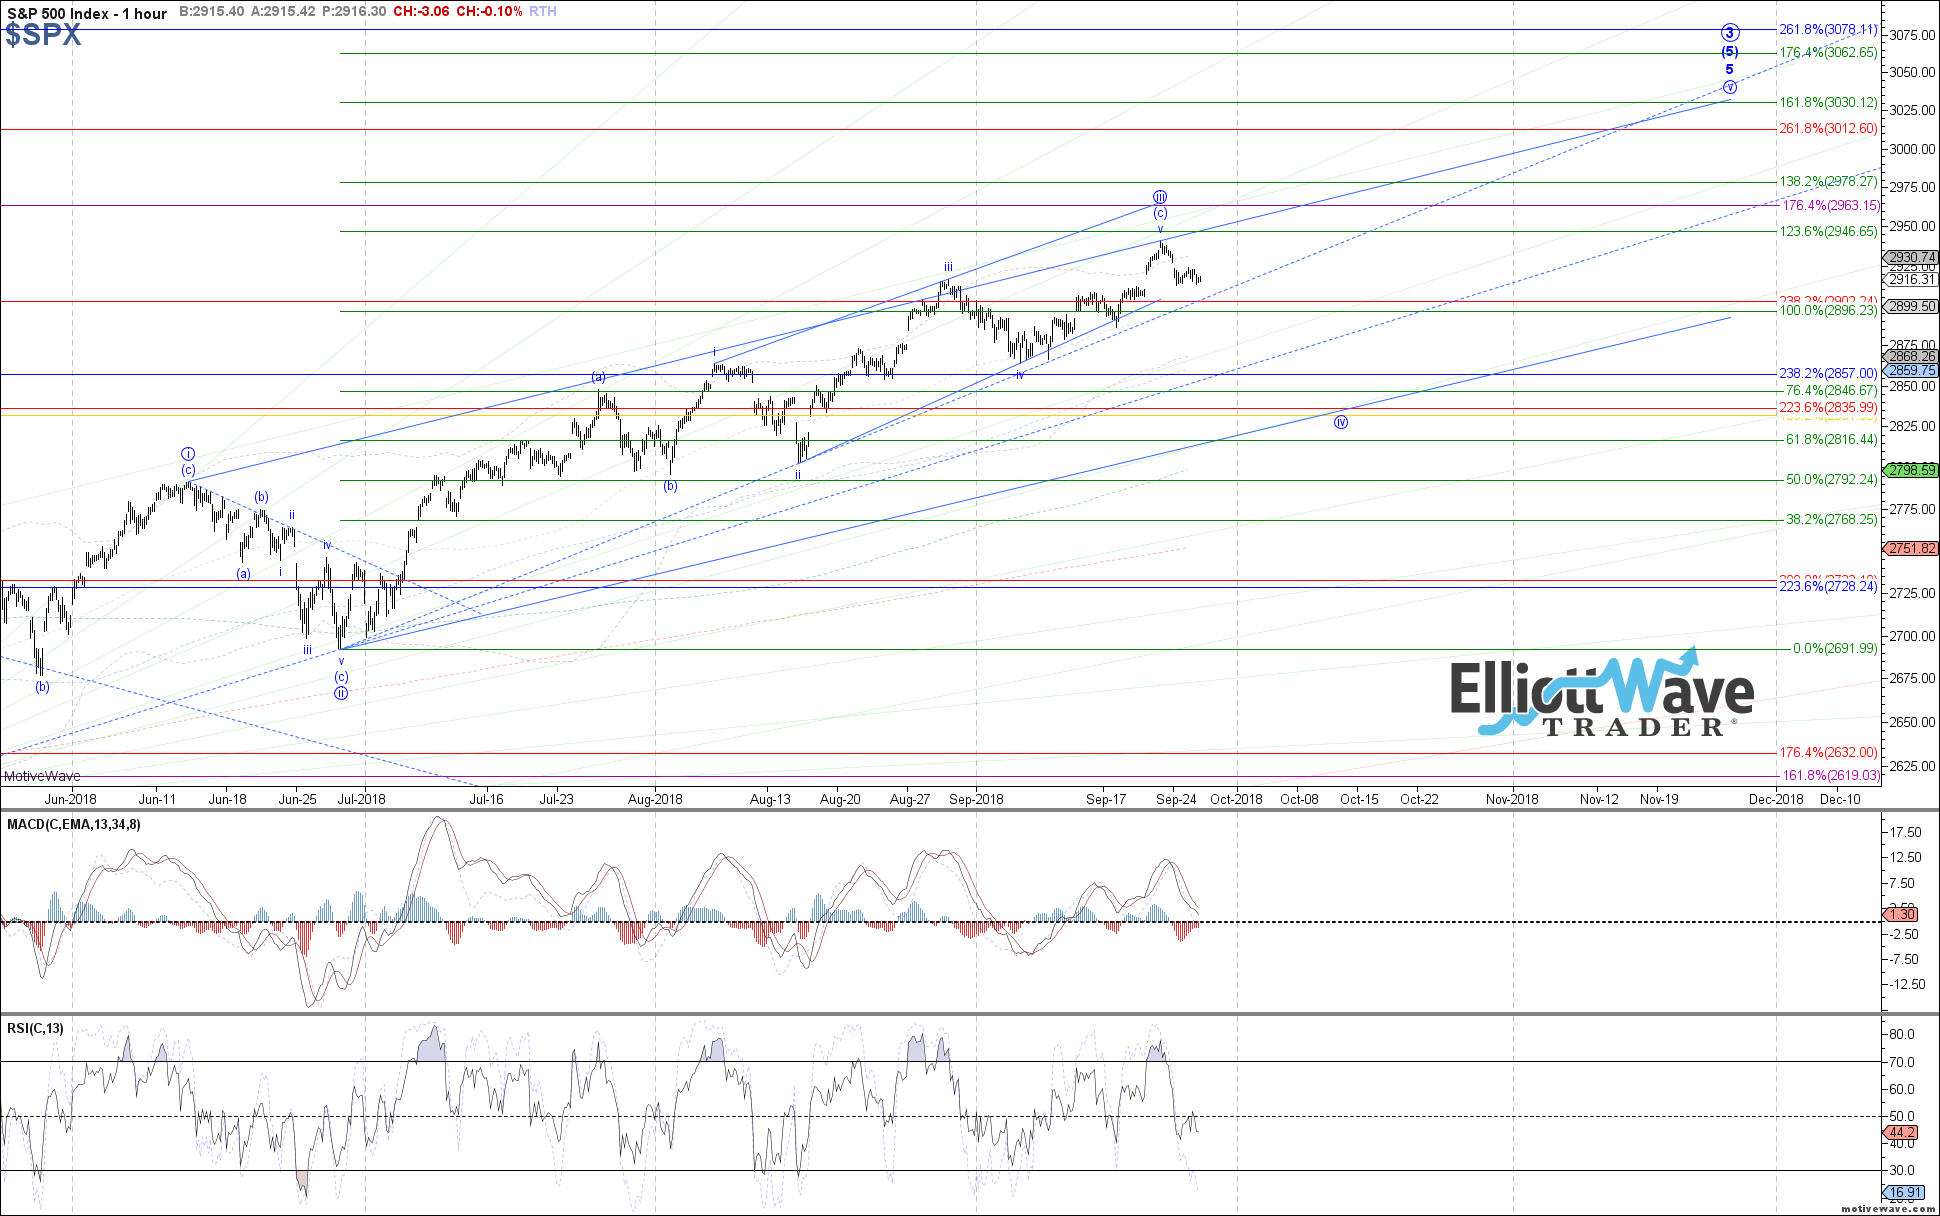
However, if price shows even more weakness than that, and ends up failing to hold 2900, that is when I begin to become much more concerned that last week's high already completed all of the circle wave iii, which means that there is still plenty of downside left before circle wave 4 reaches standard target support. I've illustrated that possibility on the attached S&P 500 (SPX) chart.
Otherwise, to assume anything immediately bullish and a clear setup to reach a new all-time high from here, price really needs to get back above 2936, which remains the .618 retrace of the move down off last week's high.