Market continues to follow the bullish script
 By
By
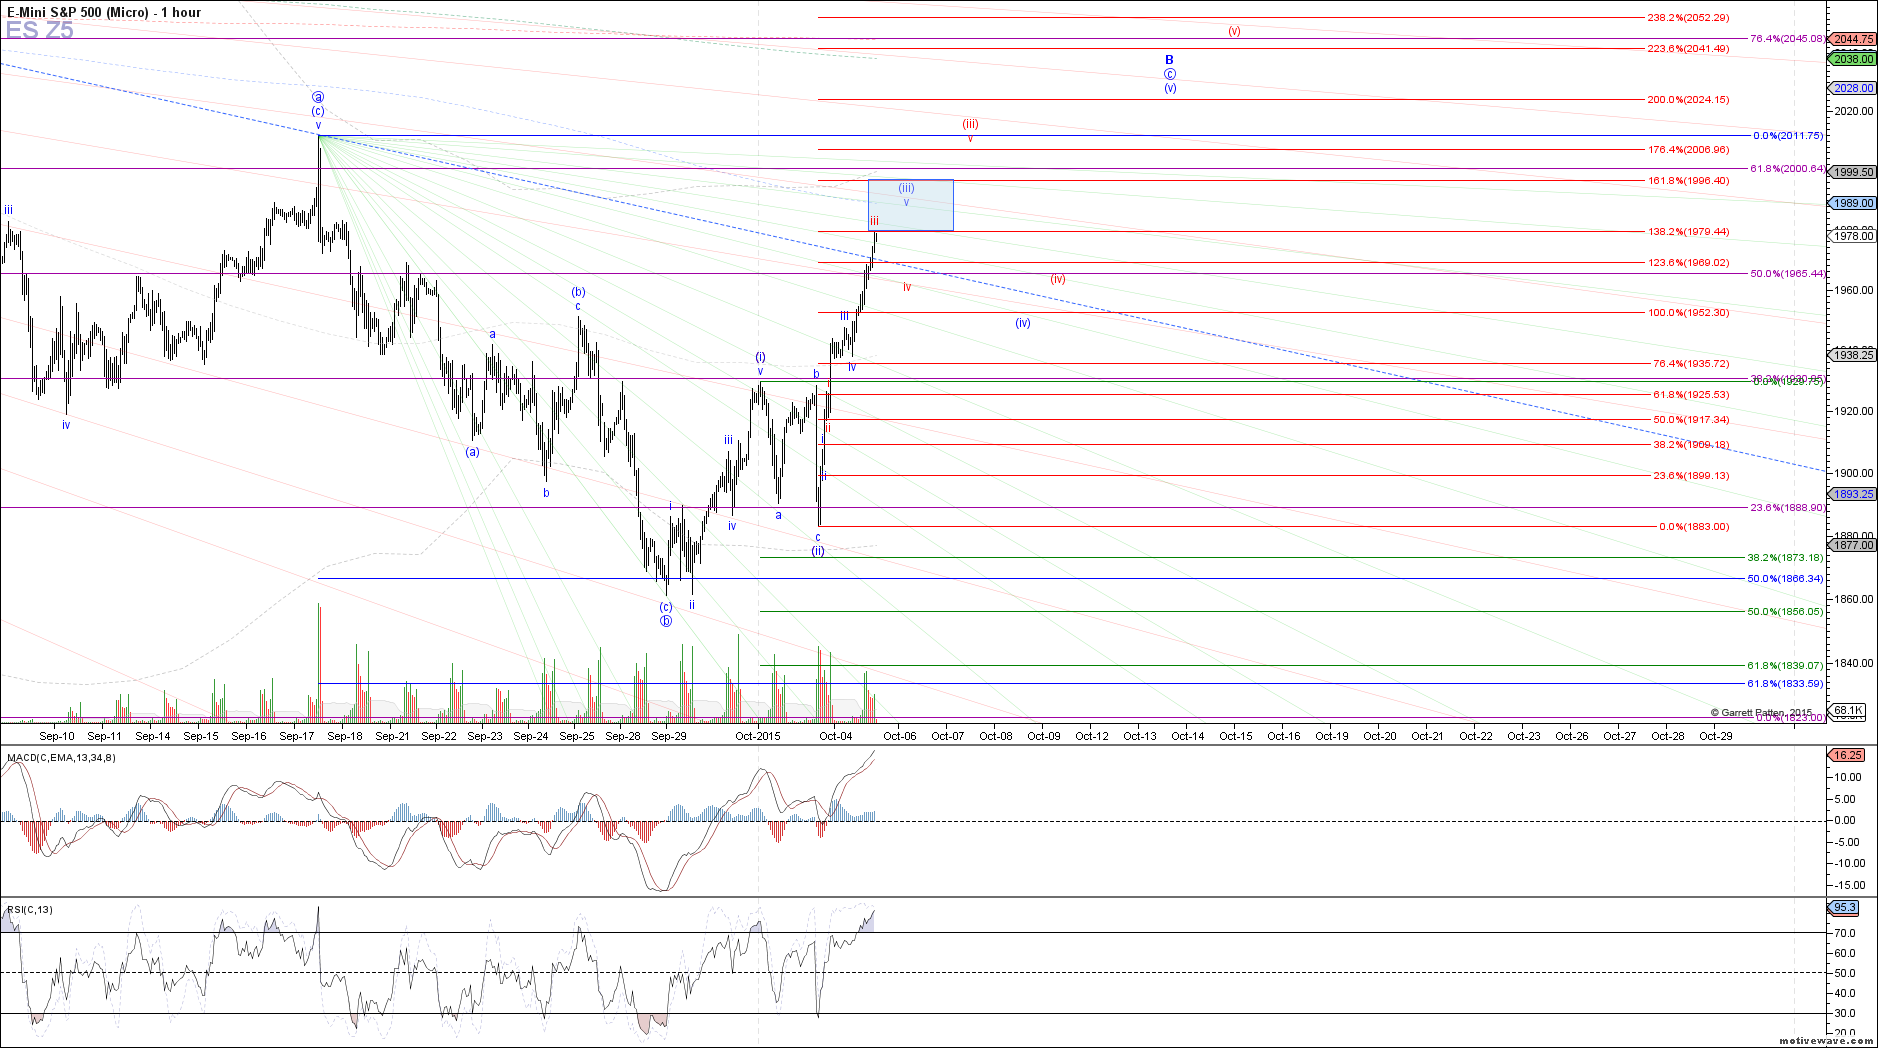
With the strong follow through we've seen today, I am taking the bearish red count off the chart for the time being only so that I can show the two variations of the bullish count as a c-wave off the September low. These counts still hinge on support at 1935.75 ES holding from here on out or else a bearish count will make another appearance.
With price extending all the way to the 1.382 extension today, which was the minimum target for wave (iii) of c in the blue count, there are two possible ways to view this impulsive structure now. Either price is already finishing of wave v of (iii) in blue, or this is an extension in wave iii of (iii) in red that should pause here at the 1.382 extension for a consolidation in wave iv.
If price is finishing off wave v of (iii) in blue and getting ready to start a larger consolidation as wave (iv), the pullback would take price back to 1952.50 - 1935.75 ES before turning back up to the September high in wave (v) of c. This scenario becomes even more likely if the 1.618 extension at 1996.50 ES is reached from here without any meaningful pullbacks. Otherwise, if we do pause here and start a pullback/consolidation at this point, today's move can be considered an extension of wave iii of (iii) in red, with support for wave iv of (iii) between 1969 - 1952.25 ES. The red count would allow for the larger .764 retrace at 2045 ES to be reached before completing this c-wave off the September low rather than just a double top or nominal new high in the blue count.