Inside day - Market Analysis for Jan 24th, 2019
 By
By
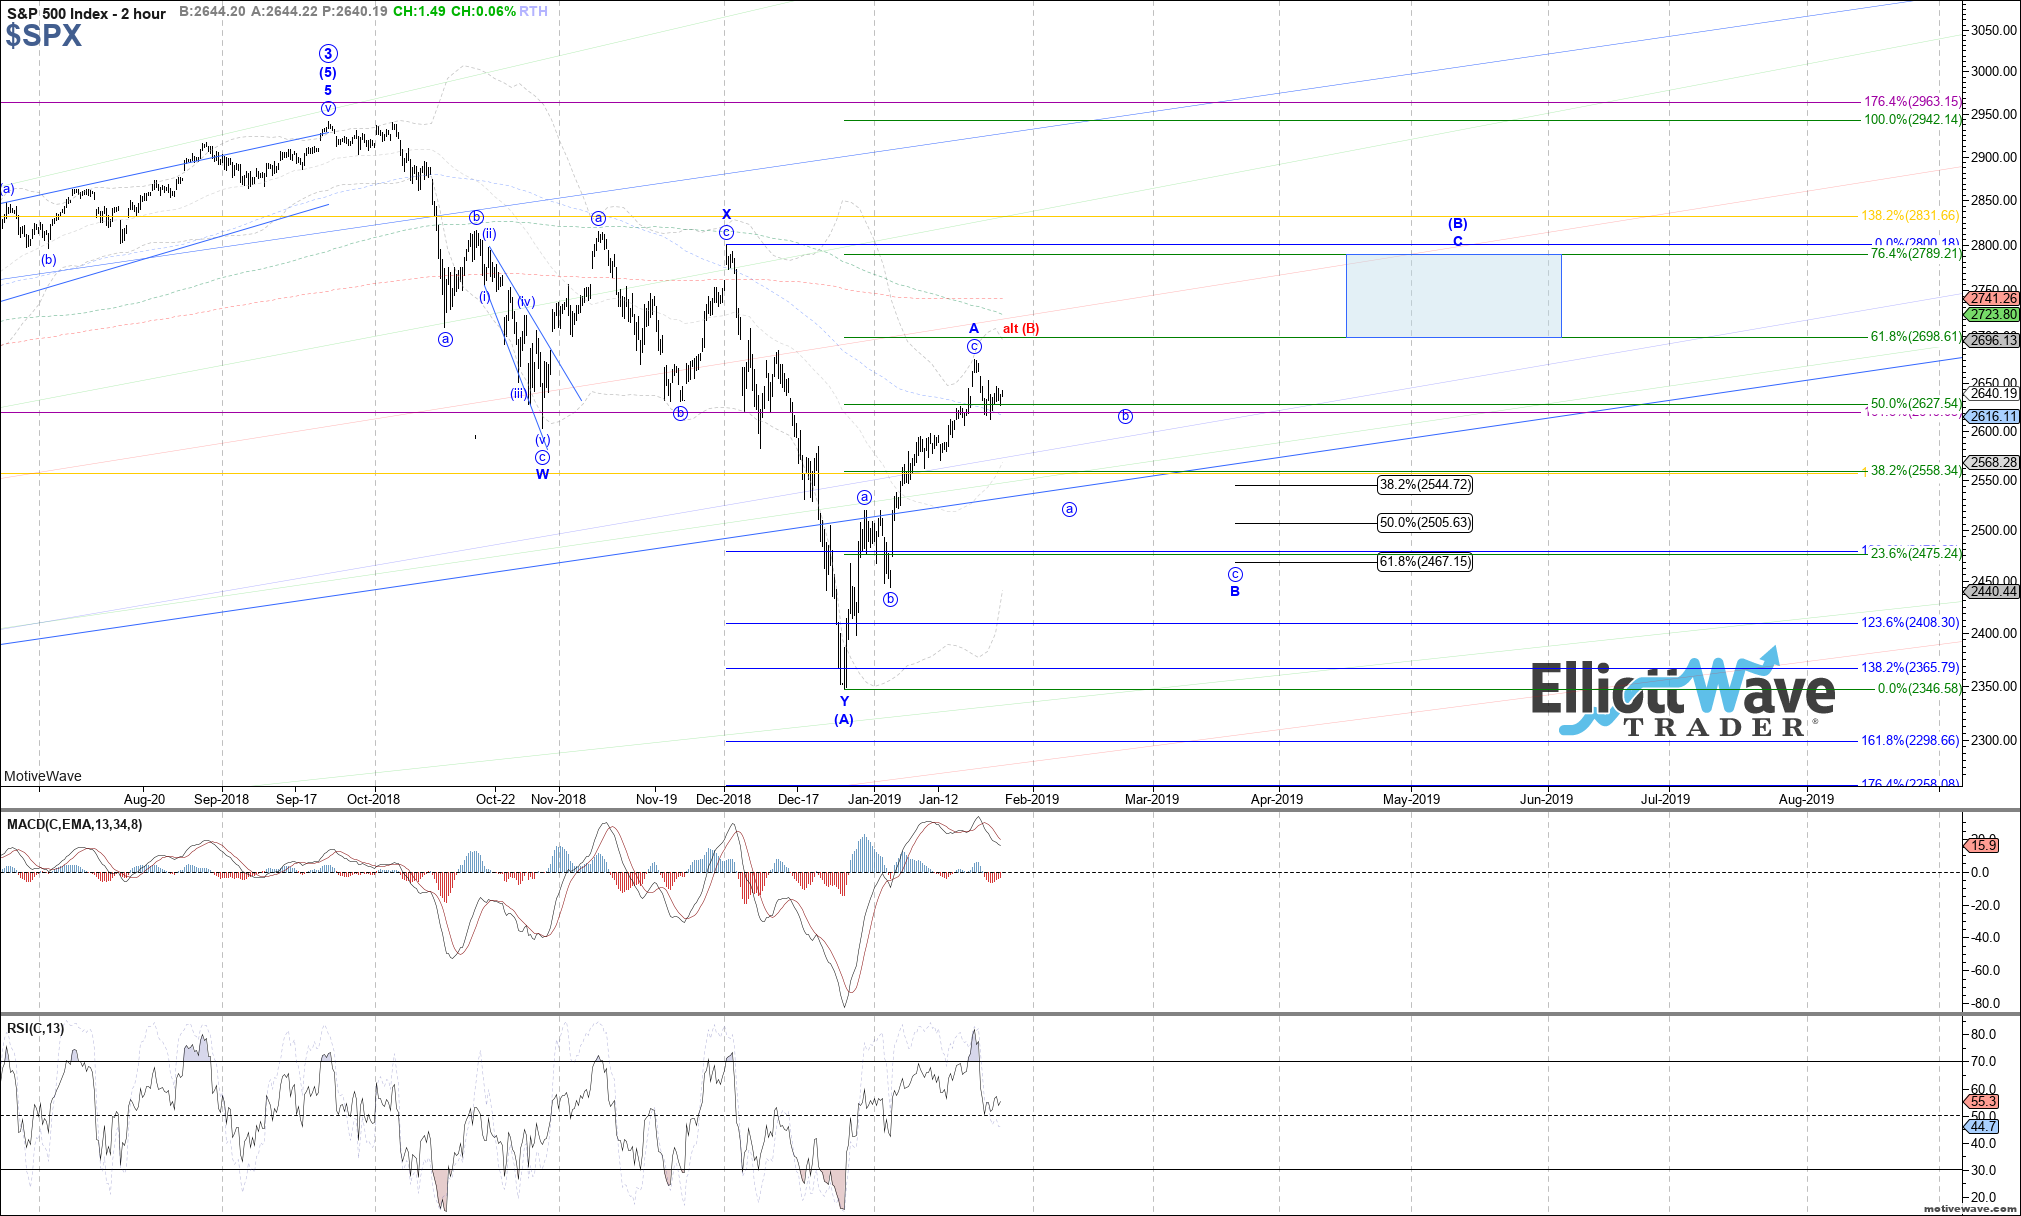
The market chopped sideways today, remaining inside yesterday's trading range for a fairly uneventful day. Therefore, there is not much to add to the prior analysis already posted. Overall, the current assumption remains that last week's high completed blue wave A of (B), and price is now beginning a corrective pullback as wave B of (B) shown on the 2 hr SPX chart.
If that thesis is correct, then further near-term downside is expected before wave B of (B) completes, with 2467 as the ideal target below as a .618 retrace of wave A. However, the path lower will not be a straight line, and can easily deliver some mini whipsaw as price makes its way down.
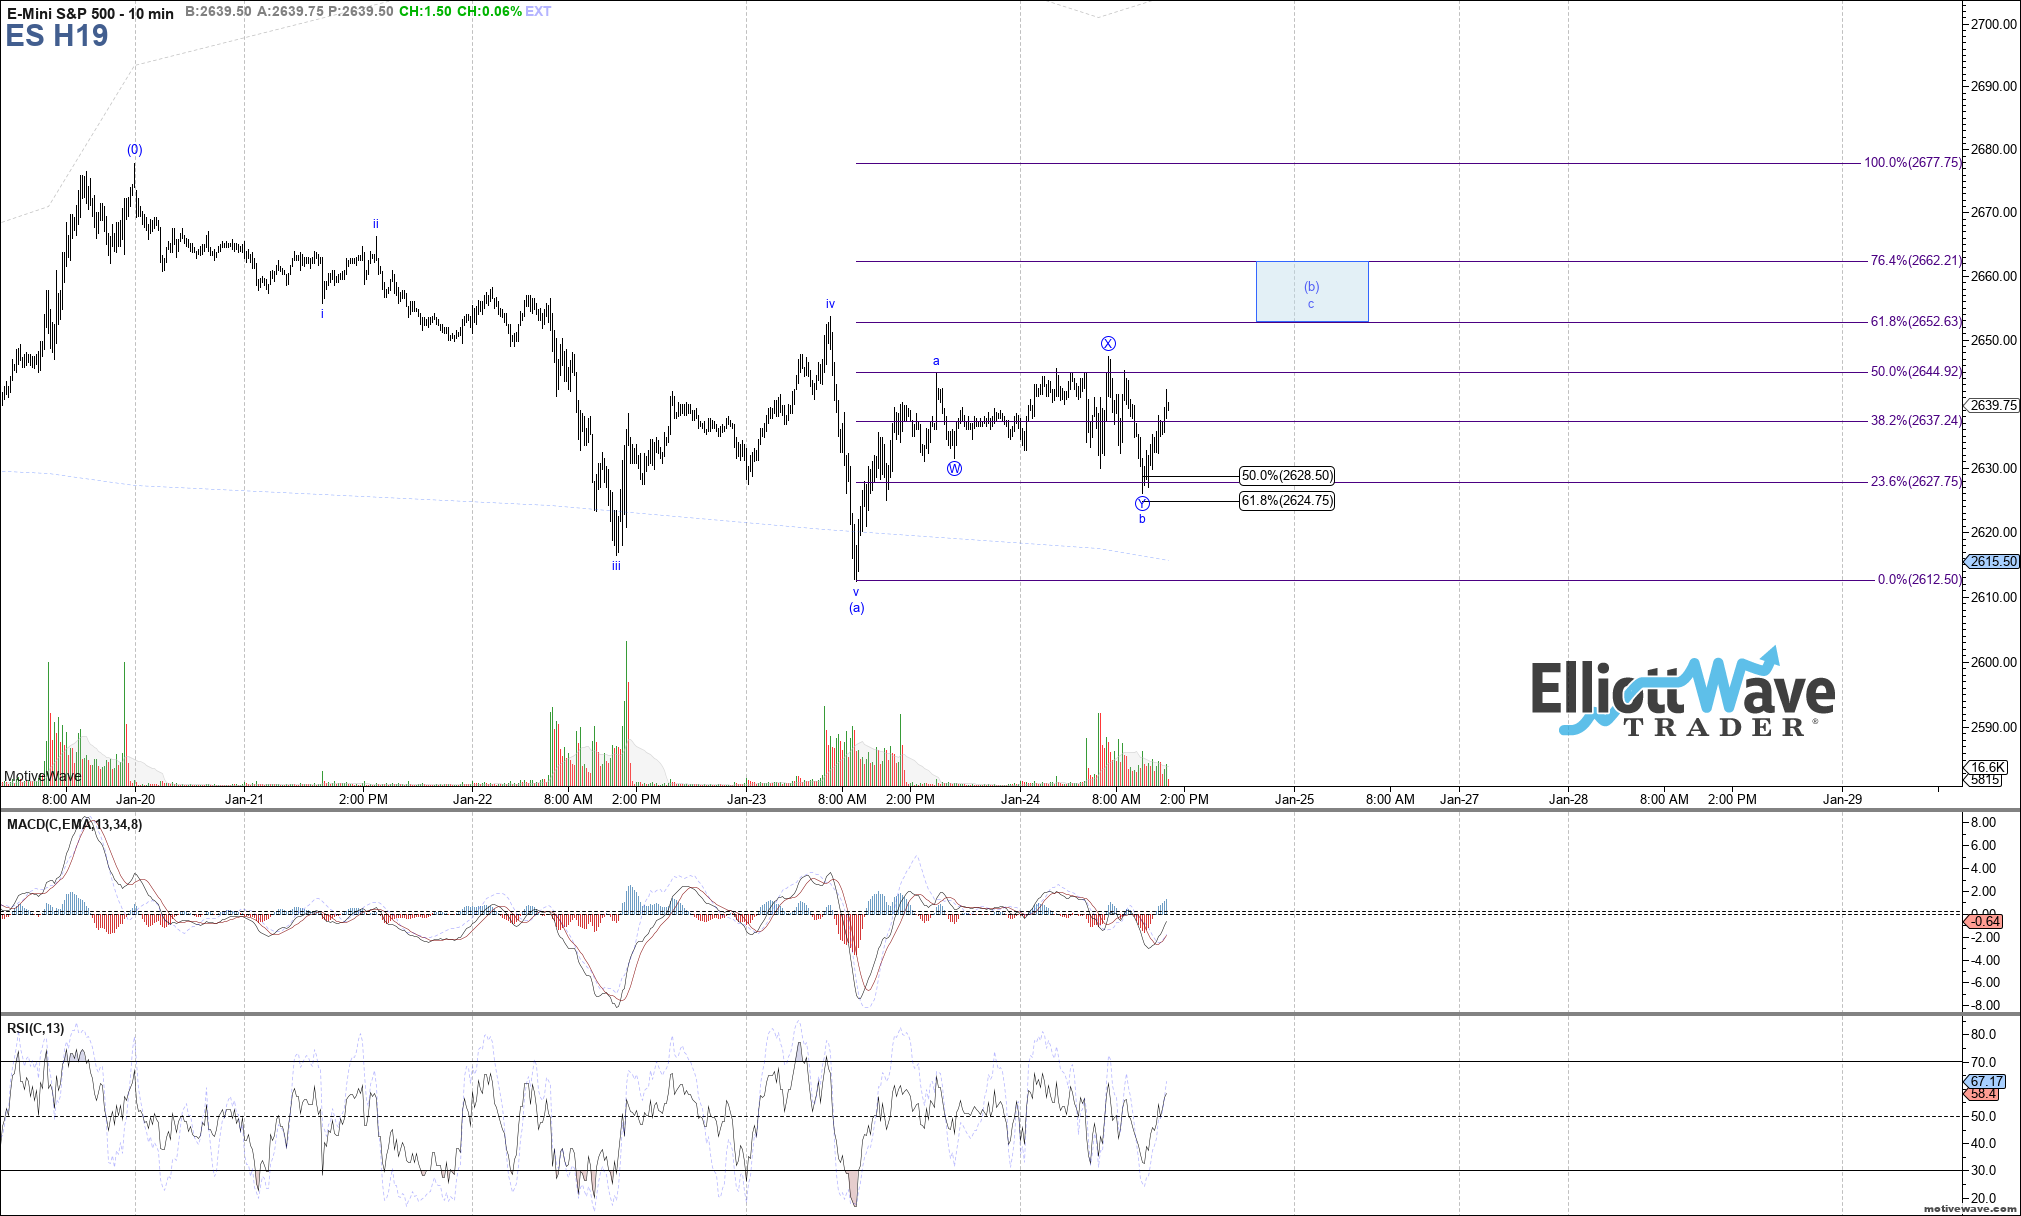
As long as the low made today on the 10 min ES chart at 2626 holds, price may want to continue higher toward 2653 - 2662 as wave c of a corrective (b)-wave flat off yesterday's low. Otherwise, a break below today's low is needed to suggest a more immediate path lower.