Initial signs of a top
 By
By
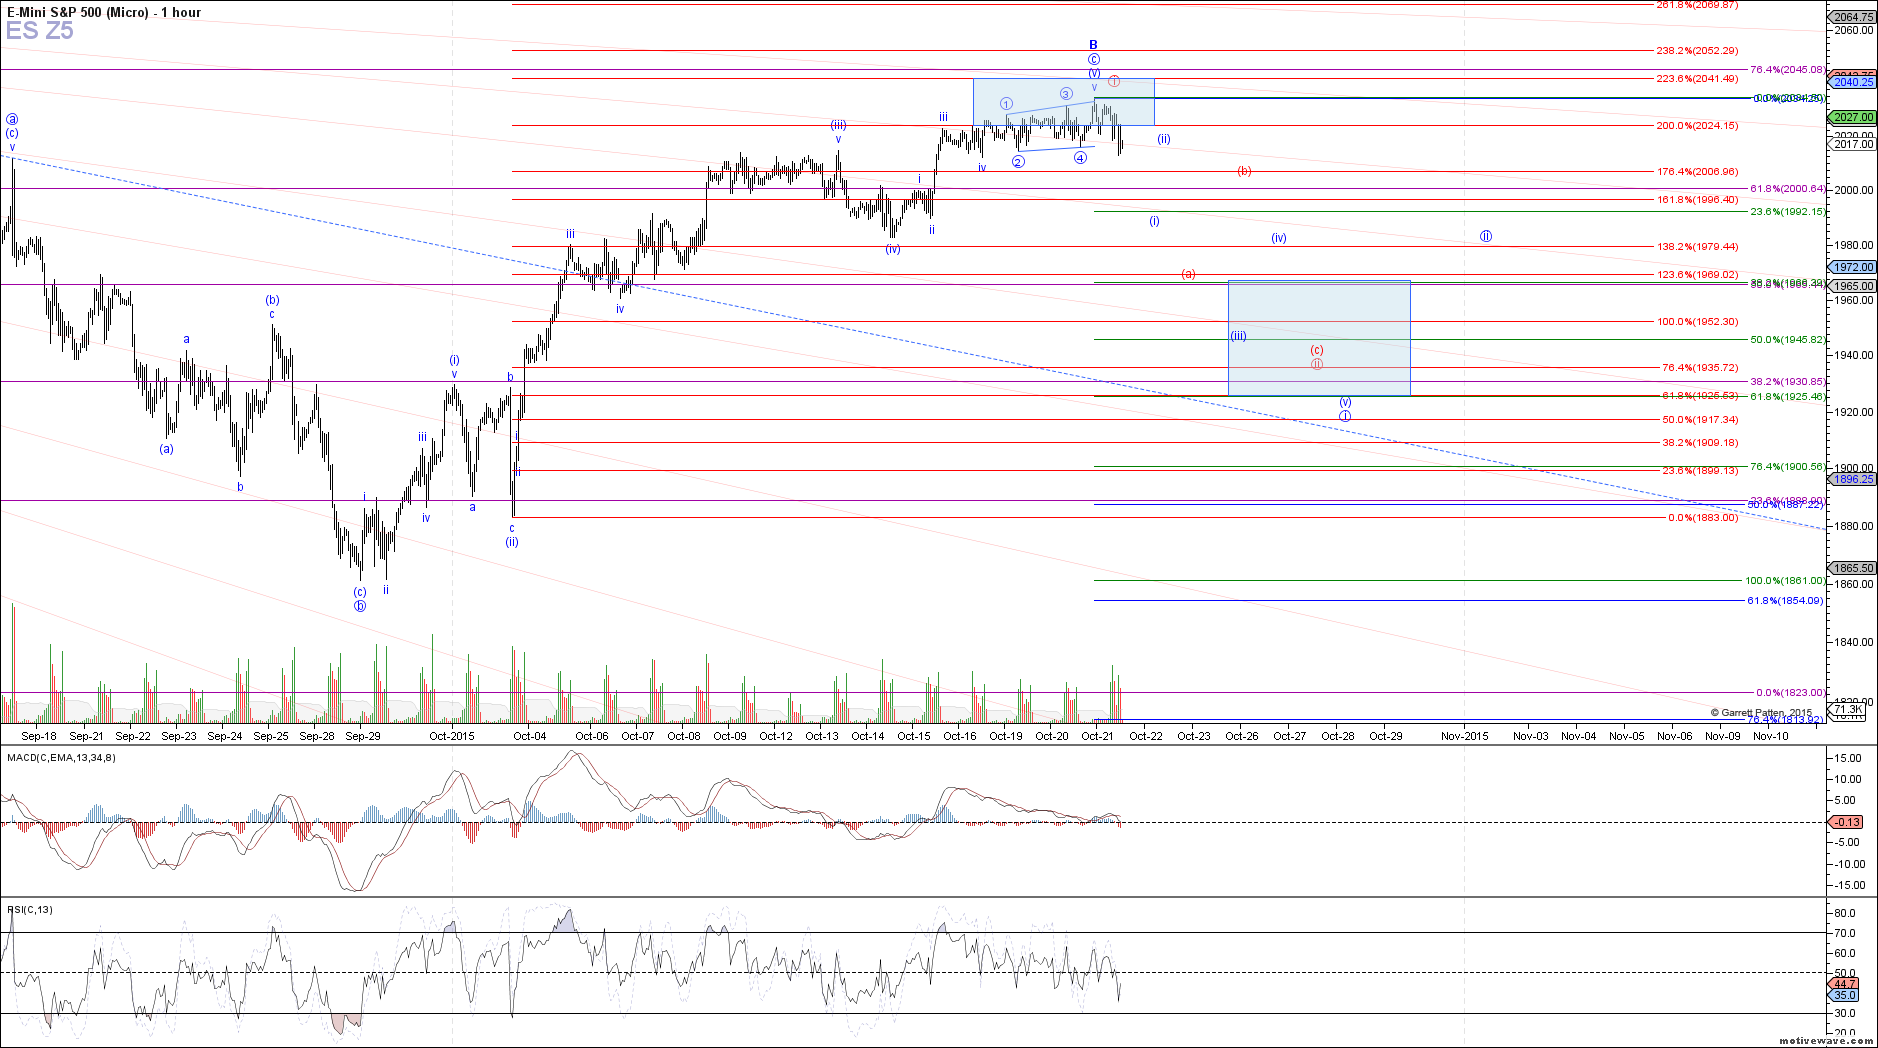
Today's market action finally gave us the initial indications of a turn, and potential top in place to this impulsive rally off the September low. In order to add further confirmation to that potential, a sustained break below 2012 ES is needed next, which was the previous low of wave iv at one higher degree. Until then, there is still an outside chance that price wants to make one more high, but even if seen, it does not change our overall expectations of a local top in this region setting up at least a corrective pullback to retrace 38.2 - 61.8% of this rally.
Assuming that price does follow through lower from here, our next task will be determining if the drop is an impulsive or corrective structure. An impulsive 5 waves down from this high is needed to confirm that price is heading to a new swing low below the August low in a C-wave under the blue count. The initial 5 down would count as wave i of C, followed by a wave ii bounce before continuing lower in wave iii to break the August low.
Otherwise, if all we get is a corrective decline that ends up taking shape as an abc, it would be much more supportive of the bullish alternative shown in red, under which the impulsive move off the September low was wave i of a larger impulse that can take us back to new all-time highs. Under both scenarios, this decline should take price down to the blue box below between 1967 ES - 1925 ES, at which point we should have our answer whether or not the decline is impulsive or corrective.