Further downside remains expected
 By
By
The market bounced into the 2654 target resistance cited this morning before putting in today's high, followed by a steep drop that eventually undercut yesterday's low. Price has since rebounded a portion of that drop, but as long as it stays below today's high then near-term pressure remains to the downside.
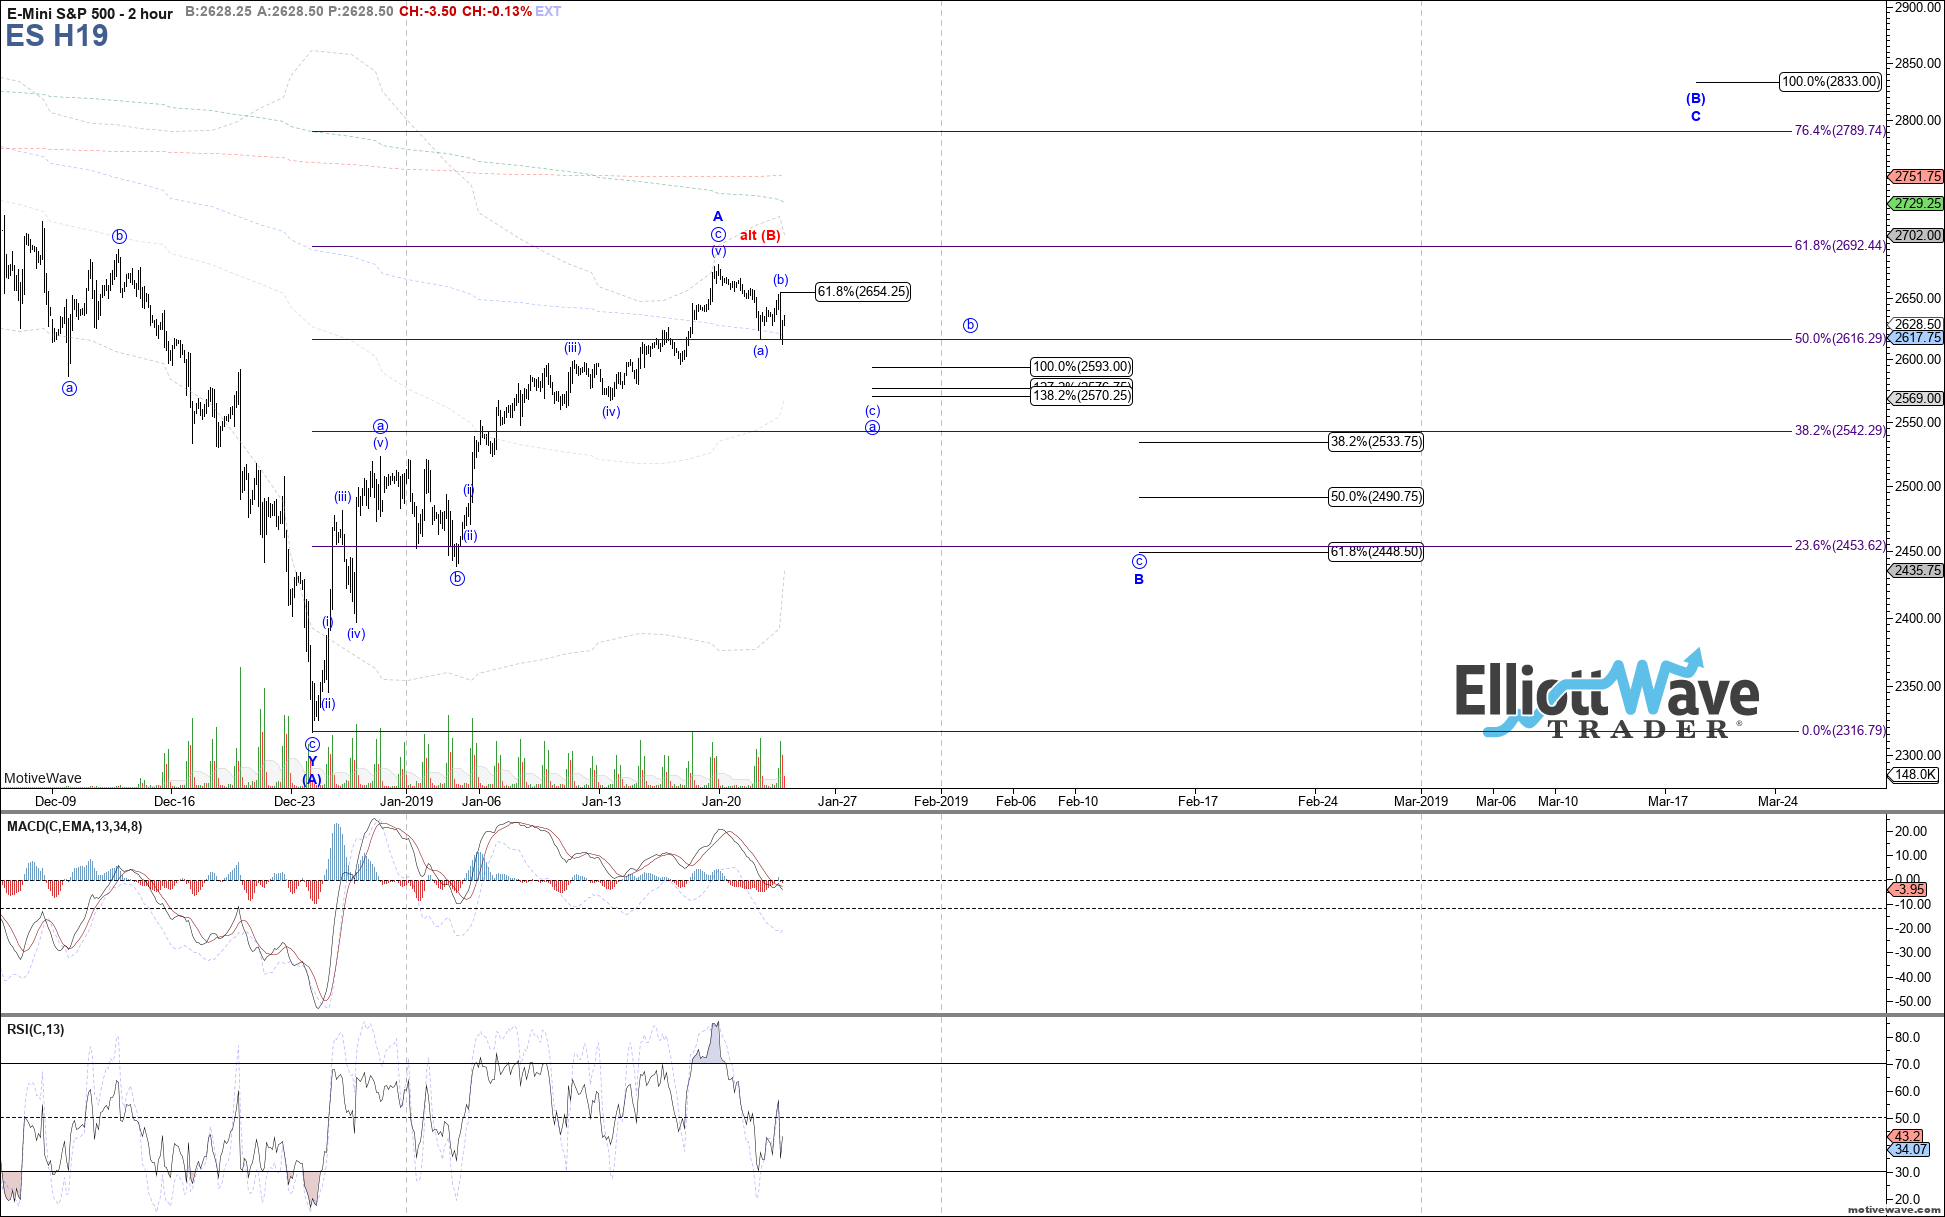
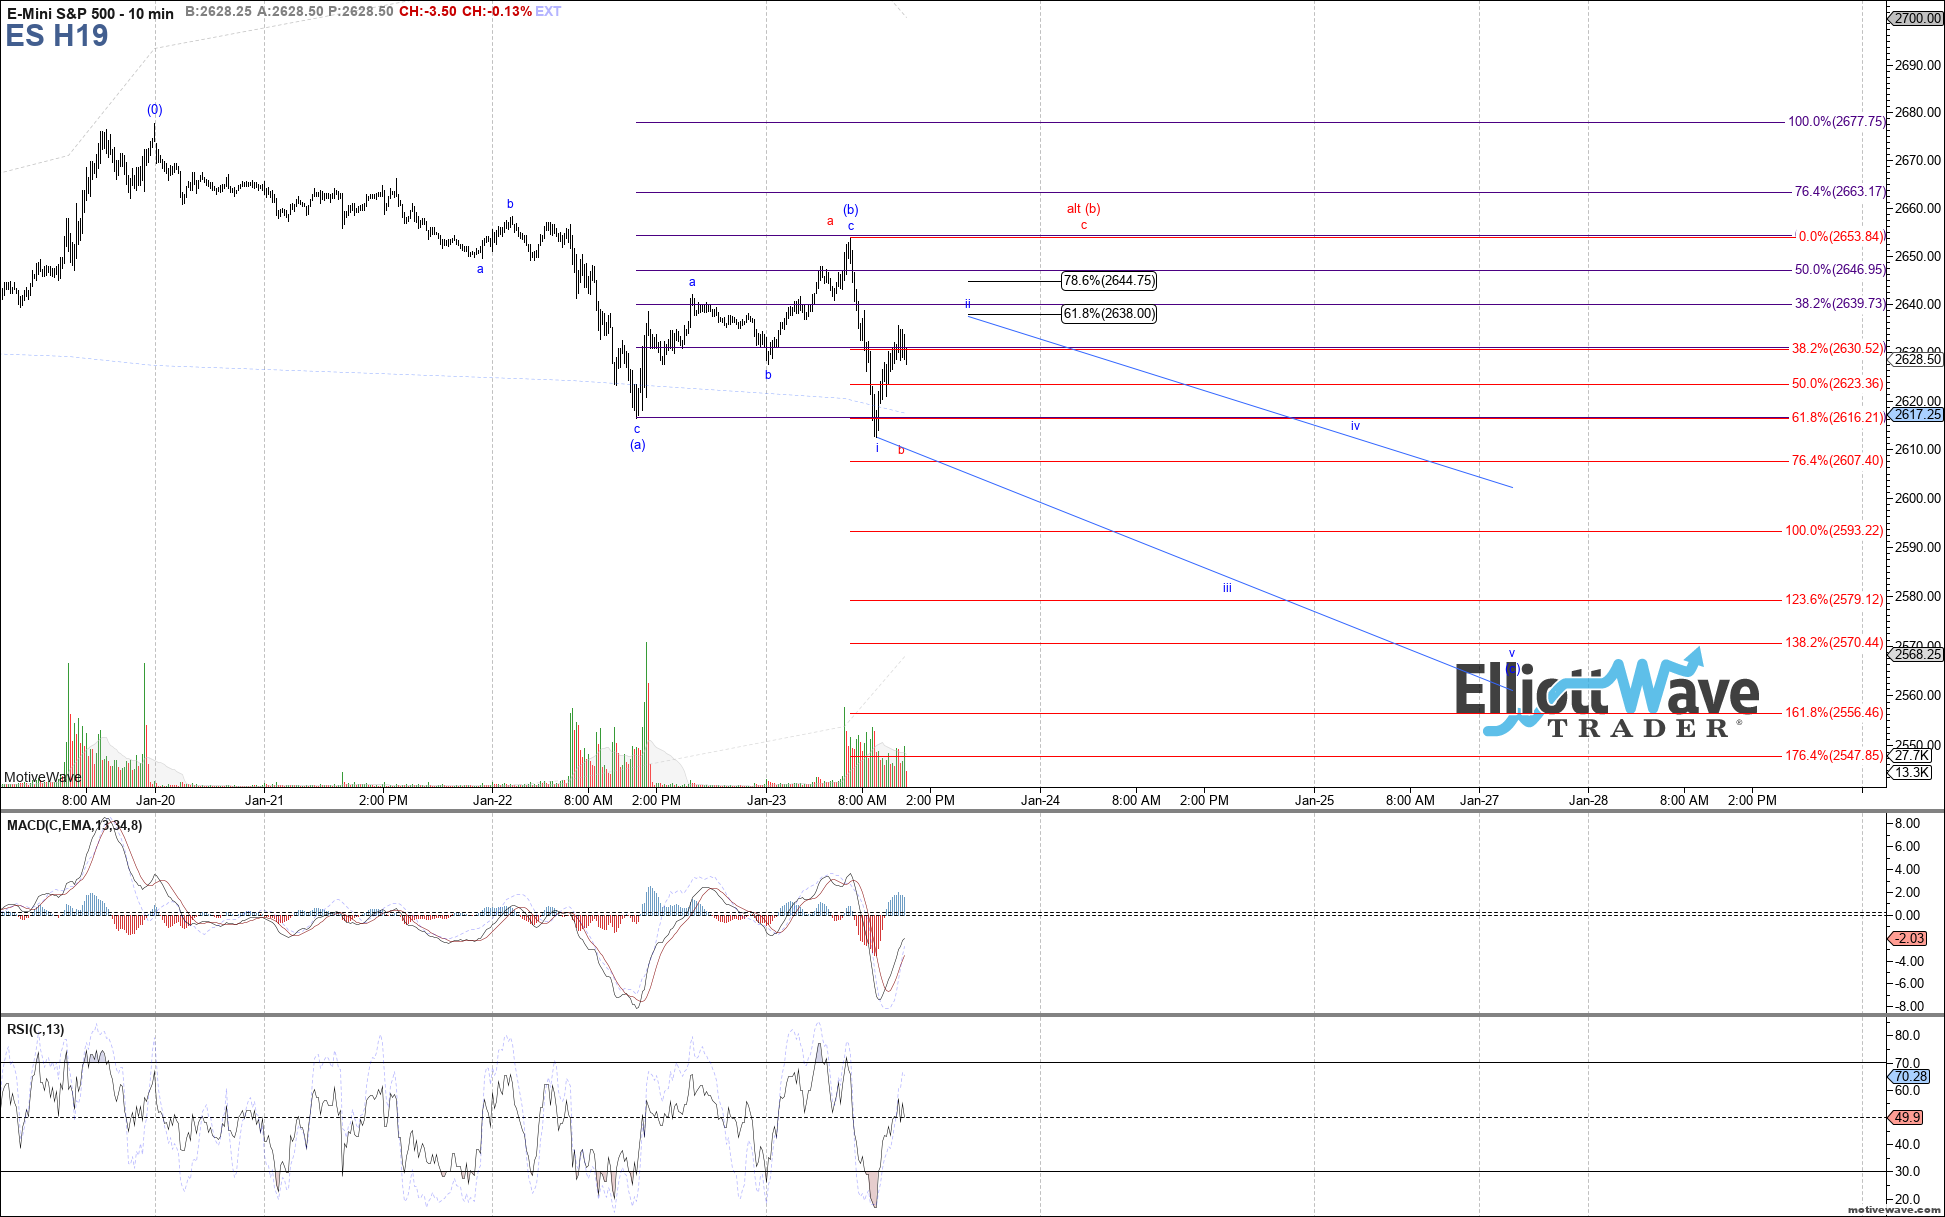
The overall assumption is still that last week's high completed wave A of (B) shown in blue, and we're in the beginning stages of a B-wave pullback (shown on the 2 hour chart). If that is the case, then wave B should take shape as an abc structure, with price still currently working on the initial wave a of B. Therefore, the high made this morning may have completed wave (b) of a, with price now setting up a i-ii start to wave (c) of a (shown on the 10 min chart).
If so, then ideally the .618 retrace of today's drop at 2638 will hold as wave ii of (c), in order to turn price down toward 2585 next as wave iii of (c). Otherwise, the .786 retrace at 2645 would be the next resistance to watch if the current bounce is still a corrective wave ii, above which would likely lead to a retest of today's high as wave c of an expanded flat (b)-wave shown in red.
The bottom line is that continued downside is still expected in order to fill out blue wave B of (B), but it can be a choppy ride as price makes its way lower.