Following downside setup - Market Analysis for Mar 19th, 2018
 By
By
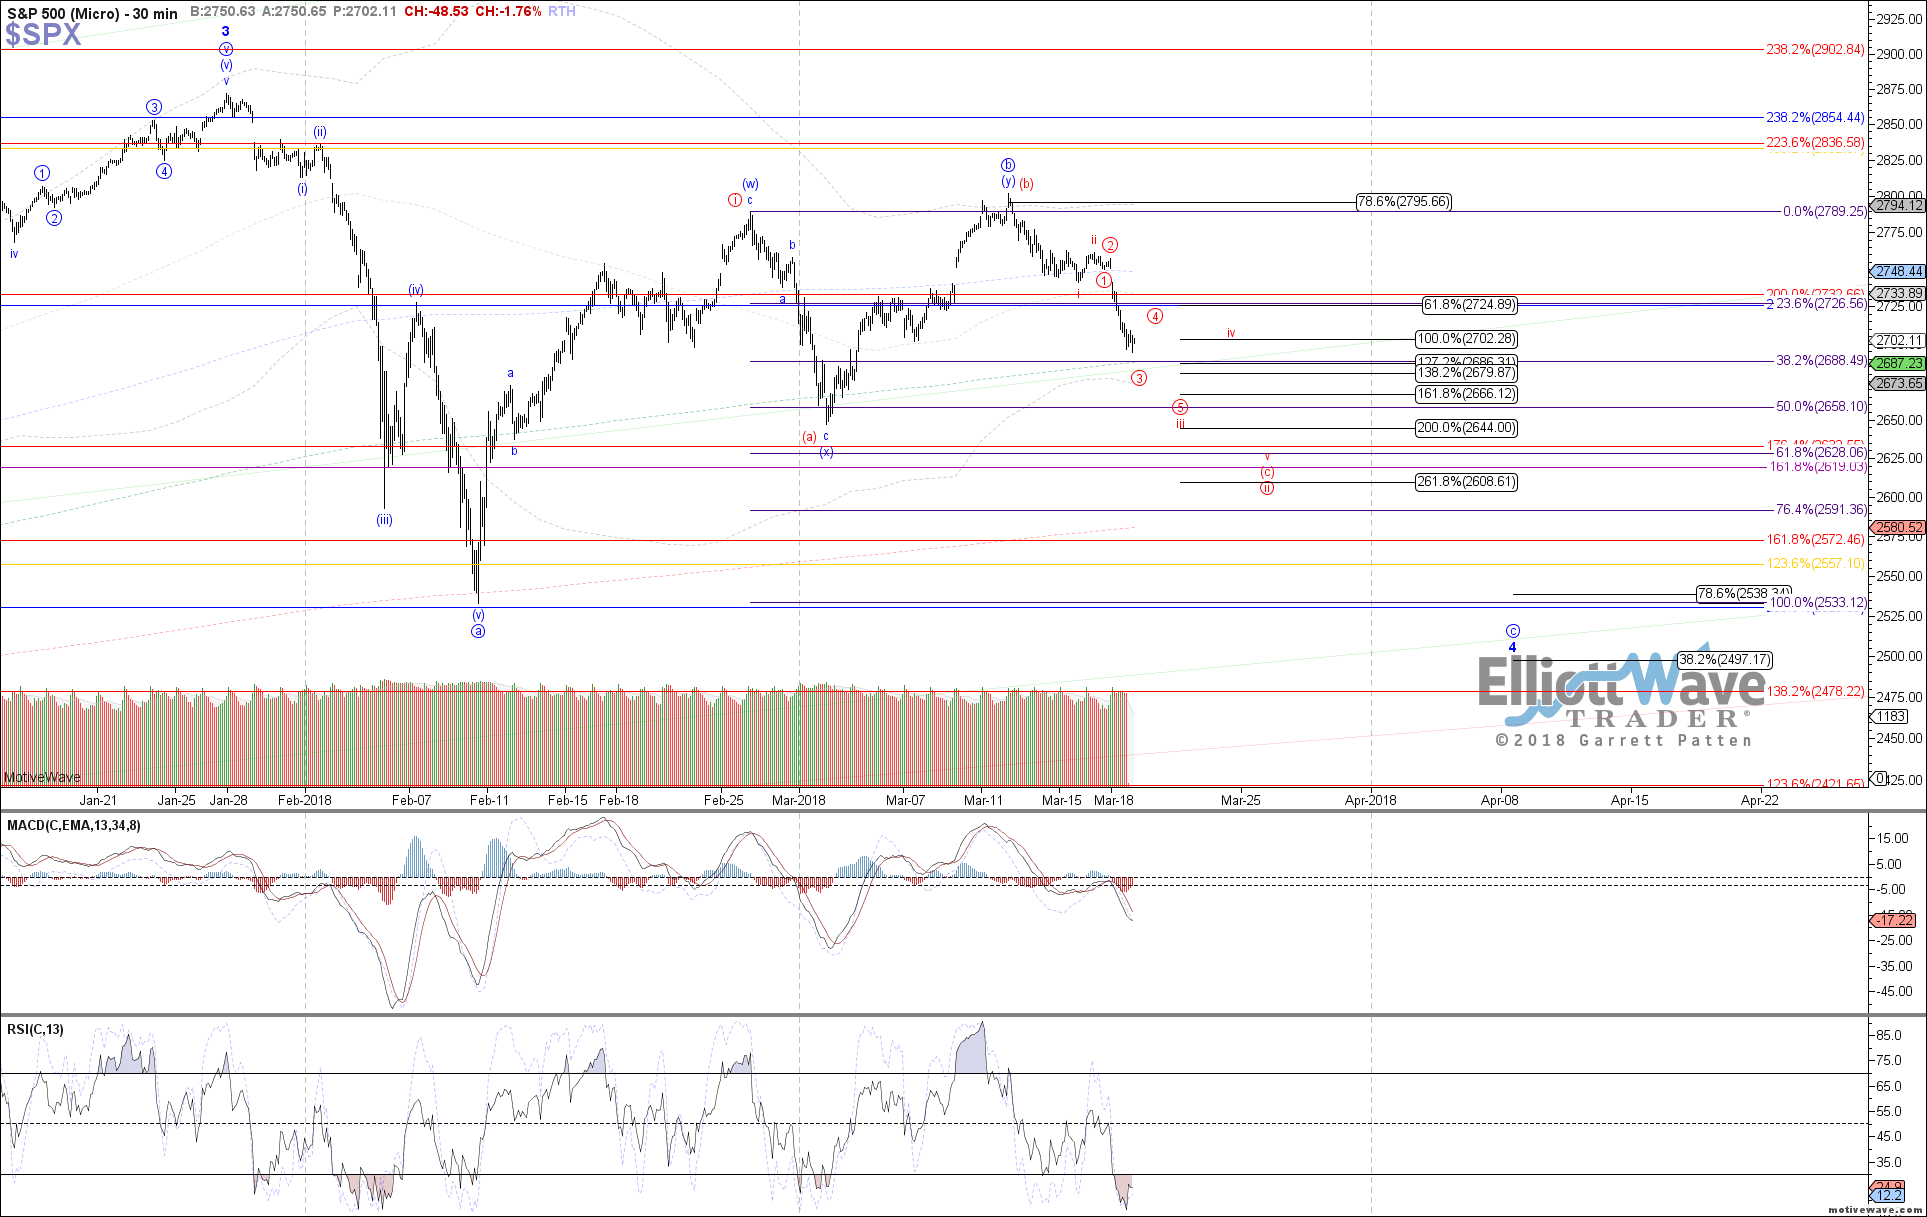
The market dropped strongly lower today, following expectations for further downside after the 50 day SMA was breached overnight by futures. Based on this downside follow through, the high made last week counts best as either the (b)-wave of an expanded flat shown in red, or the circle b-wave of a corrective wxy off the February bottom shown in blue.
The red count assumes a bottom already in place for the minor degree wave 4 at the February low, with wave i of 5 complete at the Feb. 27th high and now an expanded flat wave ii in progress since. Today's move would be the heart of wave iii of (c) under the red count, ideally stretching just a little bit lower toward 2688 SPX to complete wave 3 of iii before a bounce/consolidation in wave 4 of iii. 2725 is main resistance above that should hold to maintain this impulsive path.
Alternatively, the blue count allows for a slightly more bearish interpretation, with last week's high completing the circle b-wave of a much larger flat structure off the January top still in progress for minor degree wave 4. This would allow for price to head all the way back down, and likely below the February low before completing the larger flat close to 2500 SPX. However, so far fibs are arguing a little bit better for the red path, but that may change.