Evidence mounting for the ED
 By
By
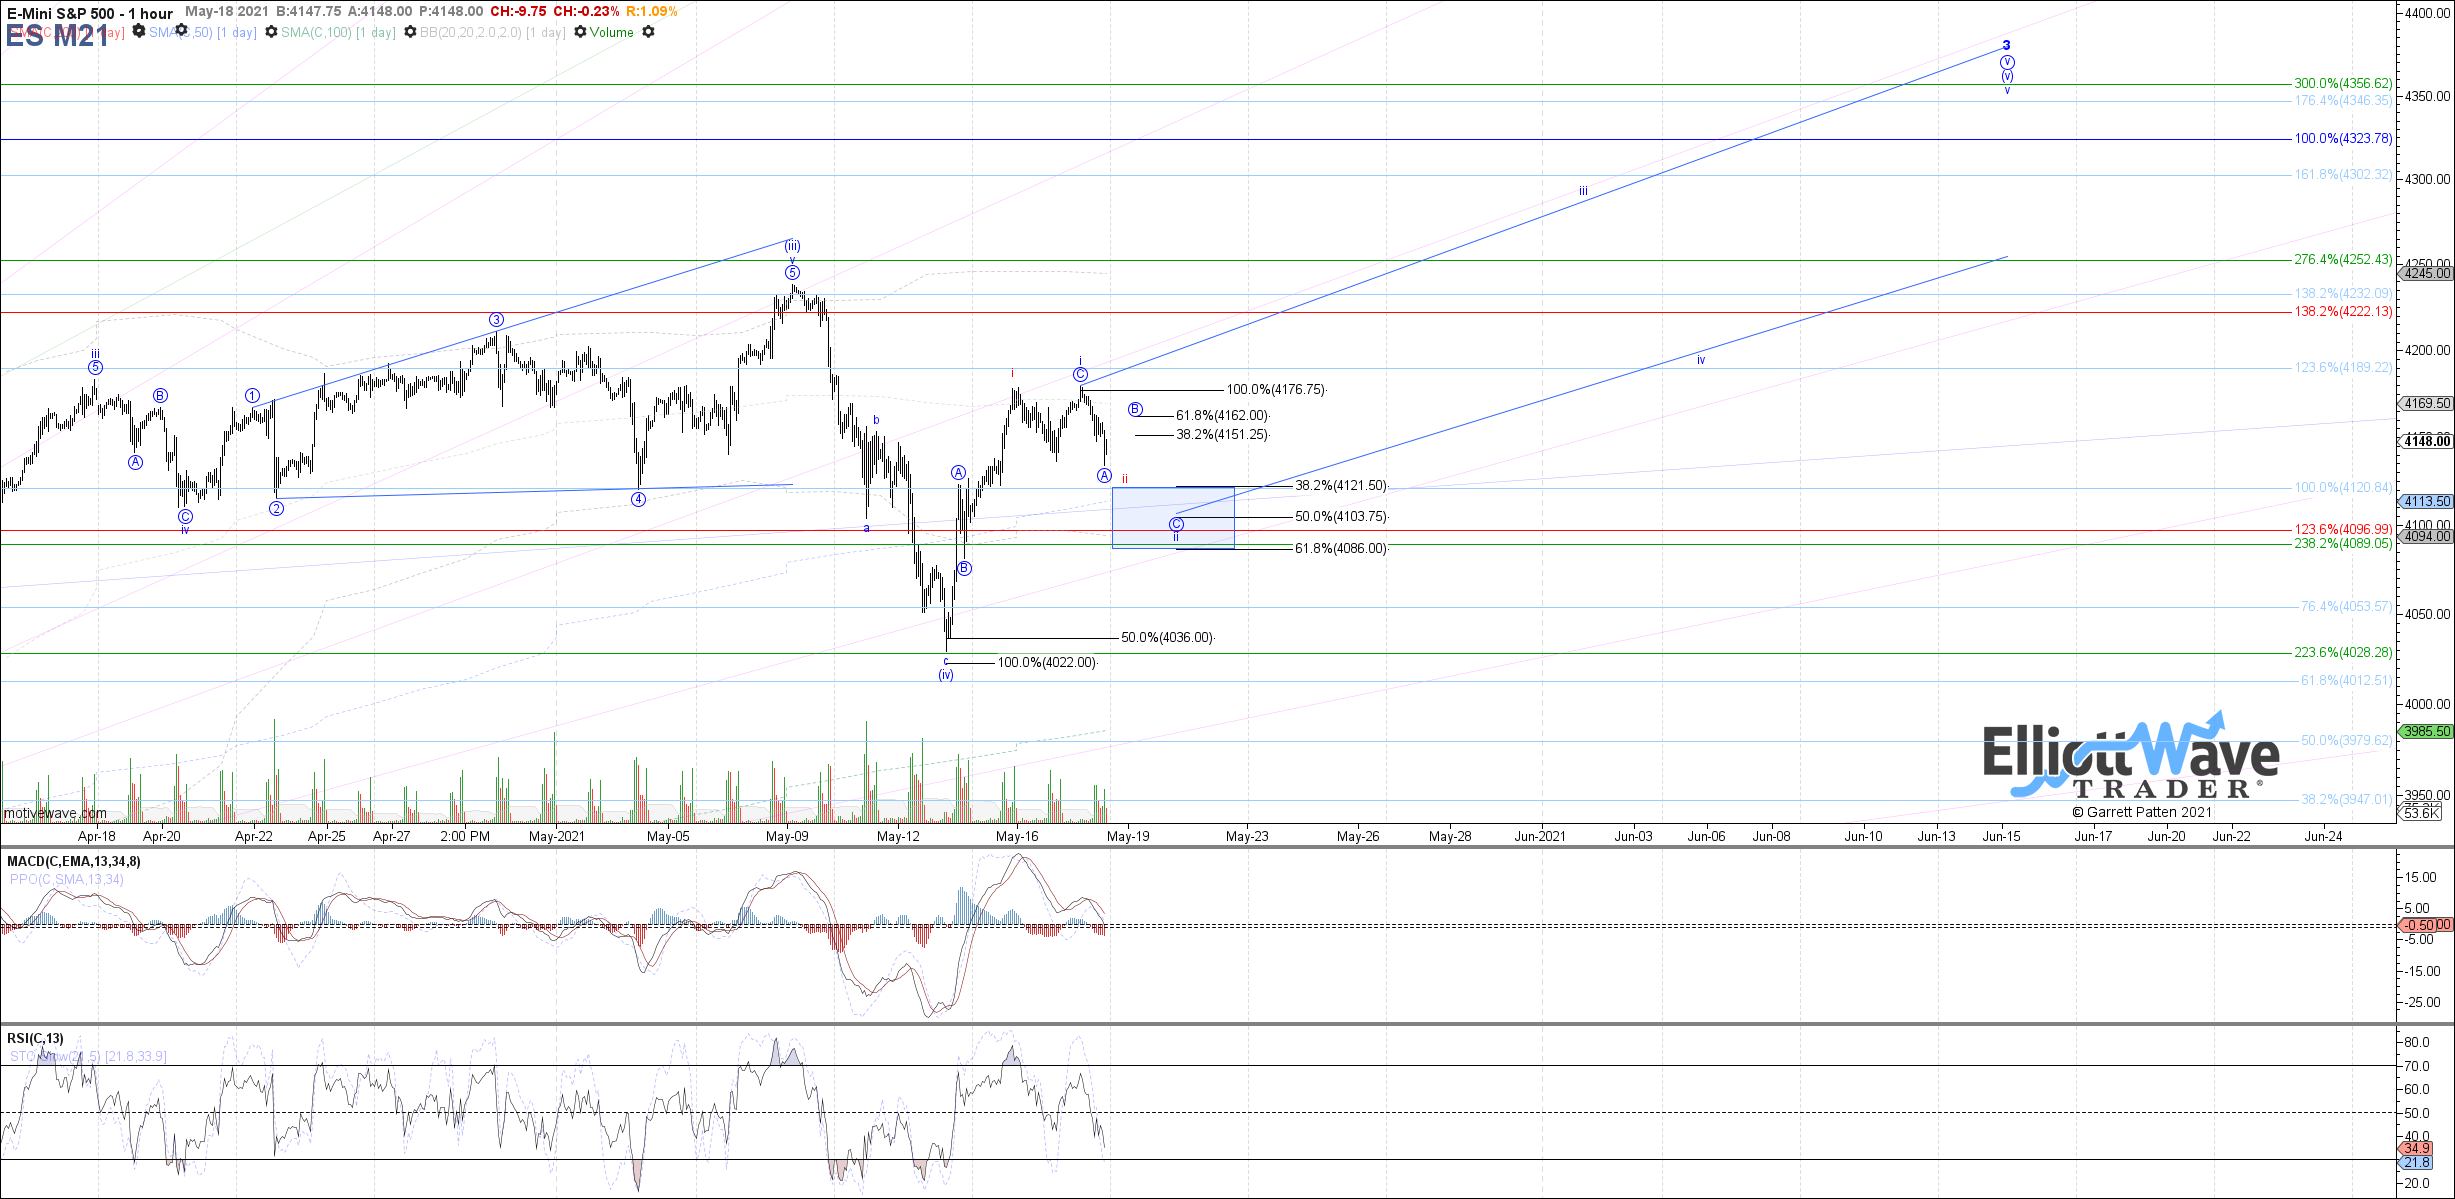
After drifting higher during the overnight session to retest the high made shortly after the Sunday open, the ES proceeded to trend down today into the afternoon low which slightly undercut yesterday's low. Therefore, we are still left without 5 up from last week's low on the SPX chart, and today's price action seems to better support the potential for an ending diagonal off last week's low instead.
If we are indeed dealing with an ending diagonal, the next question is whether it has completed already into today's low, which is possible as shown on the chart in red. If not, then today's low likely only completed wave A of ii, and price is currently bouncing in wave B of ii with 4151 - 4162 as overhead resistance that should hold in order to turn price back down as wave C of ii next.
Right now I am leaning toward the latter path in blue, which means that we can still see price ultimately reach the blue target box between 4121.50 - 4086 before wave ii completes. A sustained break above 4162 would otherwise increase odds that wave ii already completed in red.