Elliott Wave Education: Basic Analytics
 By
By
Summary
- This article will teach you each distinct price pattern that builds the overall 5-3 structure of Elliott Wave Principle.
- R.N. Elliott described these patterns as “waves,” and classified them using 6 different categories: impulse, diagonal, zigzag, flat, triangle, and combination.
- A definition and description of each category is given, including any variations of patterns within the category.
Introduction
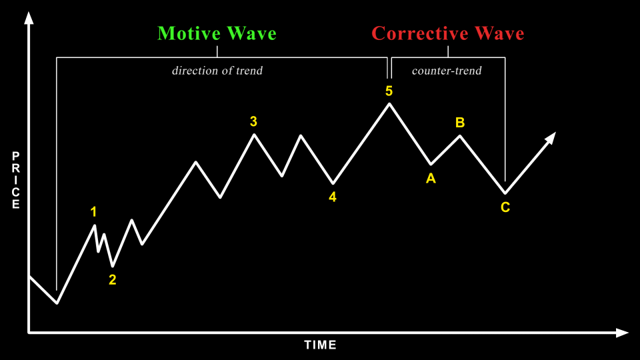
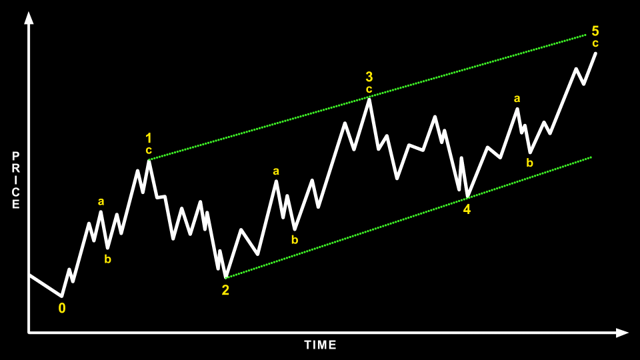
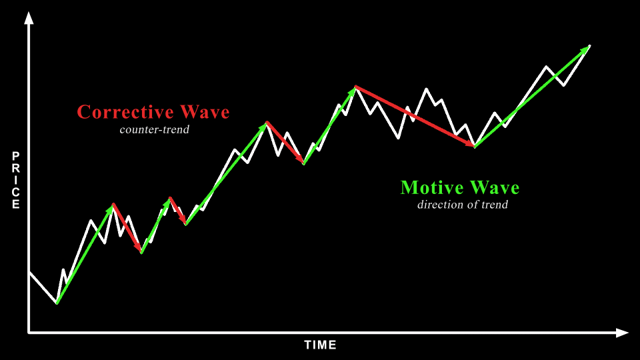
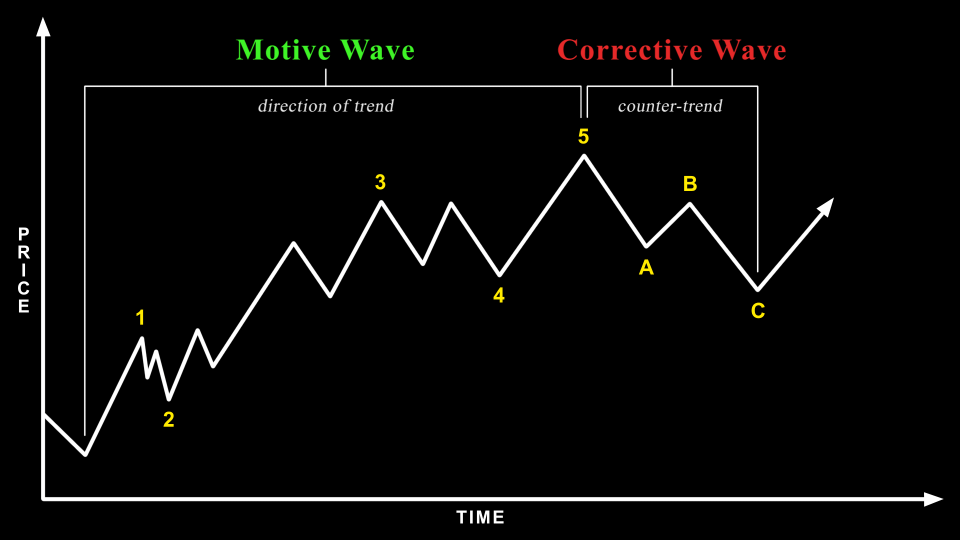
Before diving into the different categories of price patterns, let’s first establish a definition for “wave.” In the simplest terms, waves are upward and downward price swings. More specifically, waves are repetitive patterns that either progress or interrupt the direction of the larger trend. This difference in function results in two classes: motive waves and corrective waves.
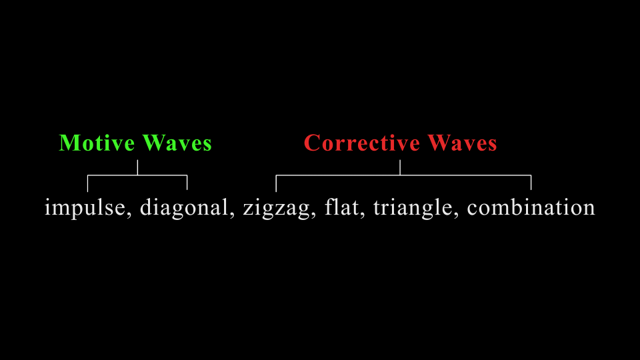
As their name suggests, motive waves progress price in the direction of the trend at one higher degree whereas corrective waves move counter to the direction of the trend at one higher degree. This applies to trends in both directions. Motive waves will always subdivide into 5 smaller waves and are labeled using numbers. Corrective waves will usually subdivide into 3 smaller waves, but can occasionally subdivide into more if a triangle or a combination. Corrective waves are labeled using letters.
Motive Waves
The most important thing to remember about motive waves is that their purpose is to make progress. With a 5 wave substructure, price is able to cover more ground than the 3 wave substructure of corrective waves. This allows the market to trend in a specific direction despite interruptions from corrective waves.
In order to achieve progress, four simple rules must be followed:
- Wave 2 cannot retrace more than 100% of wave 1.
- Wave 4 cannot retrace more than 100% of wave 3.
- Wave 3 always travels beyond the end of wave 1.
- Wave 3 is never the shortest wave.
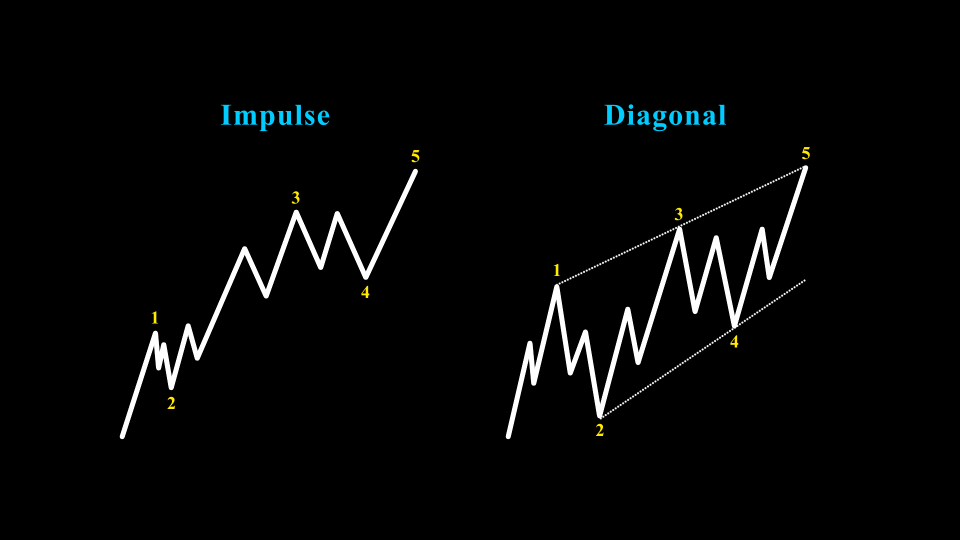
There are two variations of a motive wave: impulse and diagonal. Both serve the purpose of progressing price in the direction of the larger trend, but they have distinctly different characteristics.
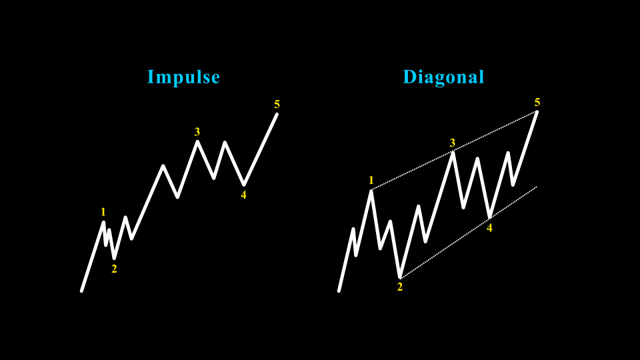
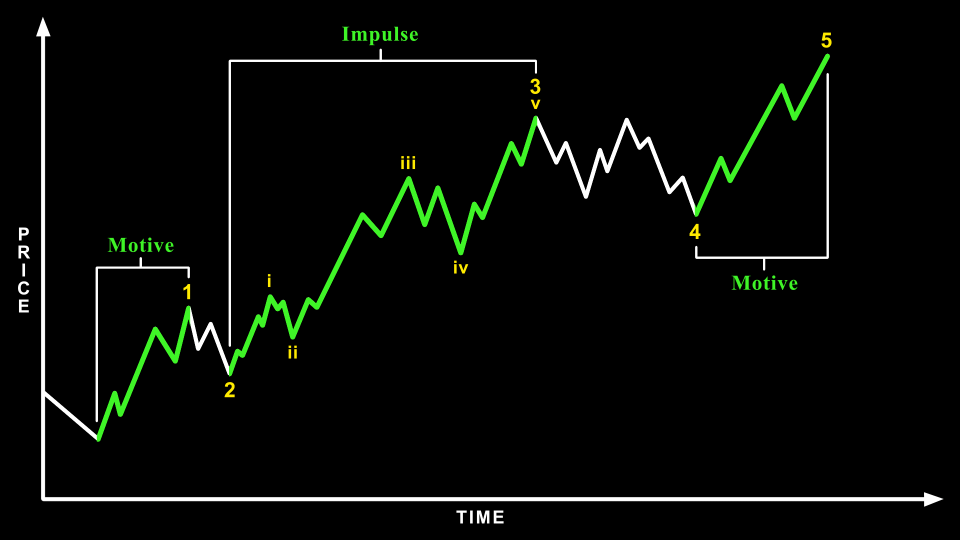
Impulse
The name “impulse” invokes a sense of urgency. Impulse waves are swift and powerful, when the market is trending its strongest. They are easily recognizable with the least amount of variation, and therefore the most desirable wave to trade. Fibonacci Pinball also works best when applied to an impulse.There are a few supplementary rules that define impulse waves in addition to those that must hold true for all motive waves.
- Wave 4 cannot overlap into wave 1 price territory.
- Waves 1 and 5 must be motive (subdivide into 5 waves).
- Wave 3 must be an impulse following these same rules.

There are also guidelines that are typically observed but not officially required for an impulse:
- Waves 2 and 4 tend to alternate in both form and duration (e.g. zigzag vs. flat).
- One actionary subwave (1, 3, or 5) typically extends significantly longer than the other two. Wave 3 is by far the most common subwave to extend.
- Subwaves should exhibit Fibonacci relationships between each other and more specifically follow Fibonacci Pinball.
Diagonals
Diagonals are also motive patterns, but more muted than an impulse. They still progress price in the direction of the larger trend, but do so with less urgency and often containing overlap. Their most defining characteristic is that the actionary subwaves also trace out as corrective patterns, rather than motive.
The result is a more labored advance and often overlap between waves 1 and 4 (although not a requirement). This tends to form a parallel, contracting, or in rare instances expanding trend channel as the diagonal unfolds. The subwaves will typically form as zigzags or flats, but occasionally a combination or triangle (if wave 4) can occur.
There are two varieties of diagonal patterns: leading diagonals and ending diagonals. As their names imply, leading diagonals only occur at the origin point of a larger pattern and ending diagonals only occur at the termination point of a larger pattern. Wave 3, the middle of a motive pattern, is never a diagonal.
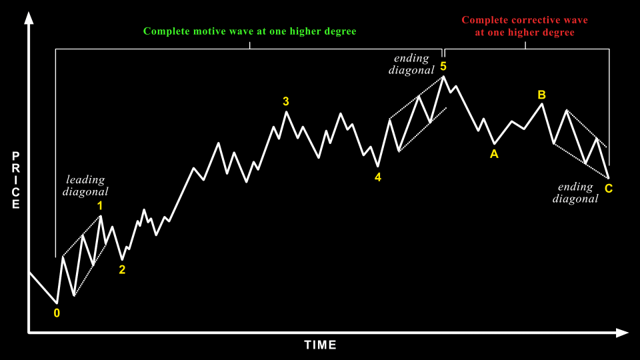
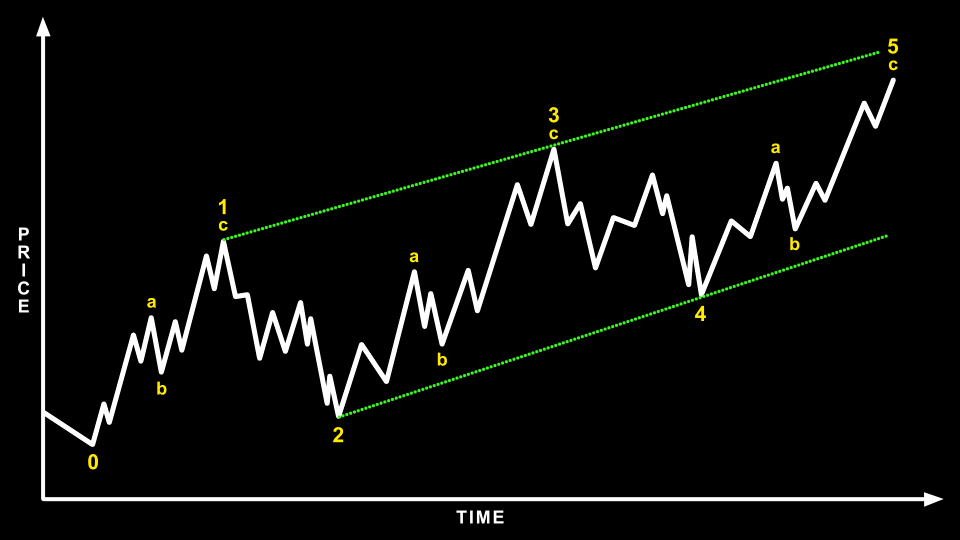
Leading Diagonal
Leading diagonals appear in the wave 1 position of a motive pattern and the A-wave position of a corrective pattern. The most common subdivision for a leading diagonal is 3-3-3-3-3, but in rare instances they will subdivide as a 5-3-5-3-5 structure.

The majority of a leading diagonal is often retraced by wave 2/B, but this is not a requirement. Leading diagonals can also be rewarding when correctly identified as wave 1, since they tend to precede powerful 3rd waves. This is also true when positioned as wave i of 3.
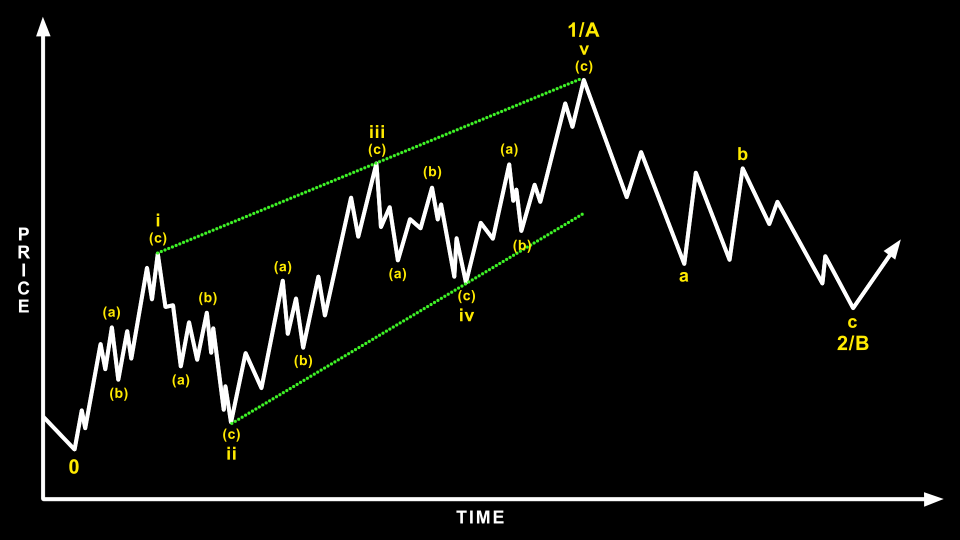
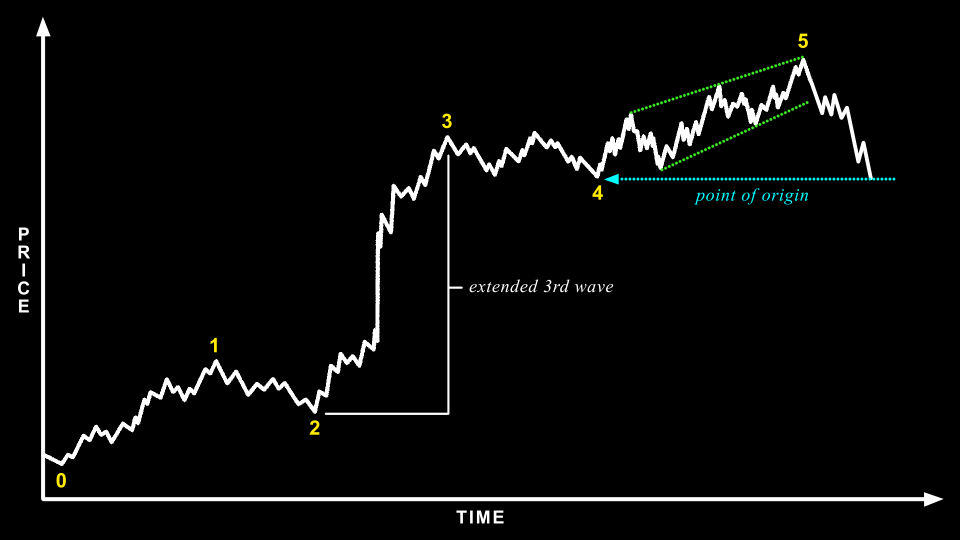
Ending Diagonal
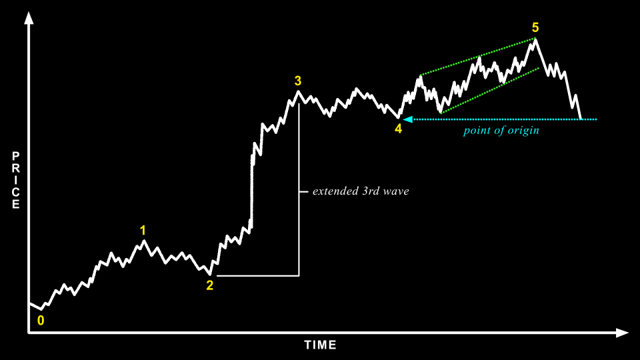
Ending diagonals appear in the wave 5 position of a motive pattern and the C-wave position of a corrective pattern. Unlike leading diagonals, ending diagonals cannot subdivide as a 5-3-5-3-5 structure, only a 3-3-3-3-3 structure.
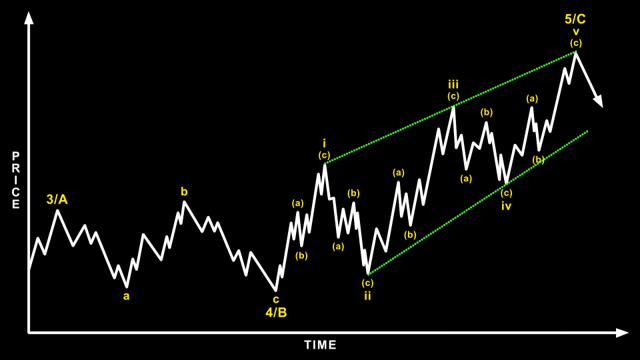
R.N. Elliott described ending diagonals as typically occurring when the preceding actionary wave went “too far, too fast” (e.g. following an extended 3rd wave). This often results in a violent reversal once the ending diagonal completes, quickly taking price back to the point where the pattern began.
Corrective Waves
Corrective waves are the result of fluctuation. Without them, markets would simply move at a constant rate of change in a straight line. Corrective waves move counter to the trend at one larger degree, as if fighting against a current. This results in a much messier, complex, and variable structure than their motive counterparts, which flow with comparative ease in the direction of the larger trend.
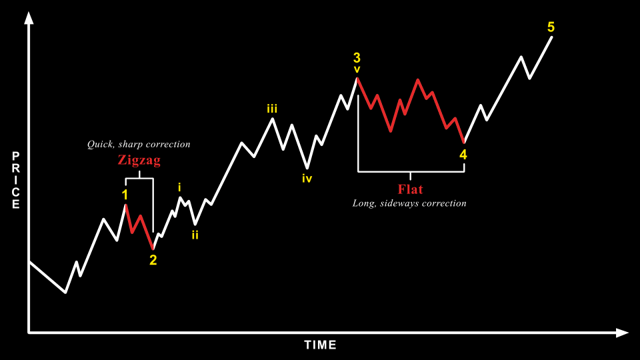
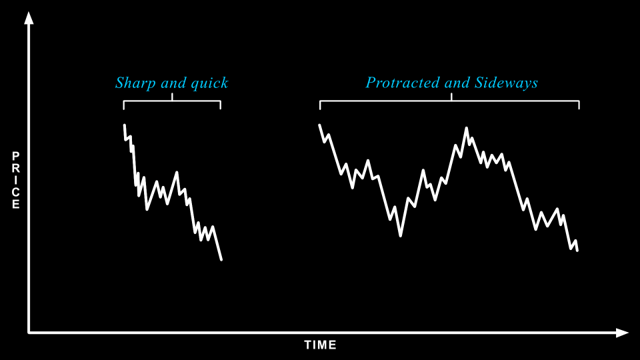
 Corrective waves typically unfold in one of two ways: a sharp and quick retracement of the preceding actionary wave, or a protracted and sideways consolidation that in comparison takes much longer in duration to complete. These two distinct characters of corrective waves can be observed when alternation occurs between waves 2 and 4 of a motive structure.
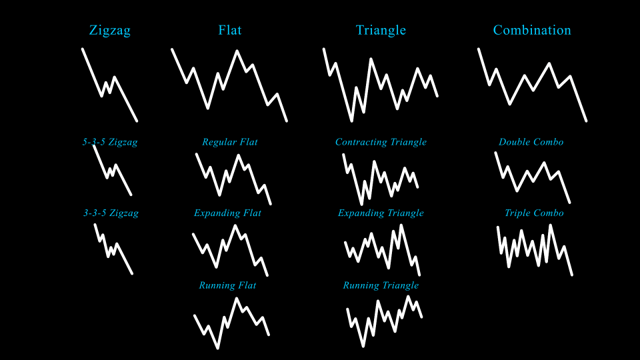
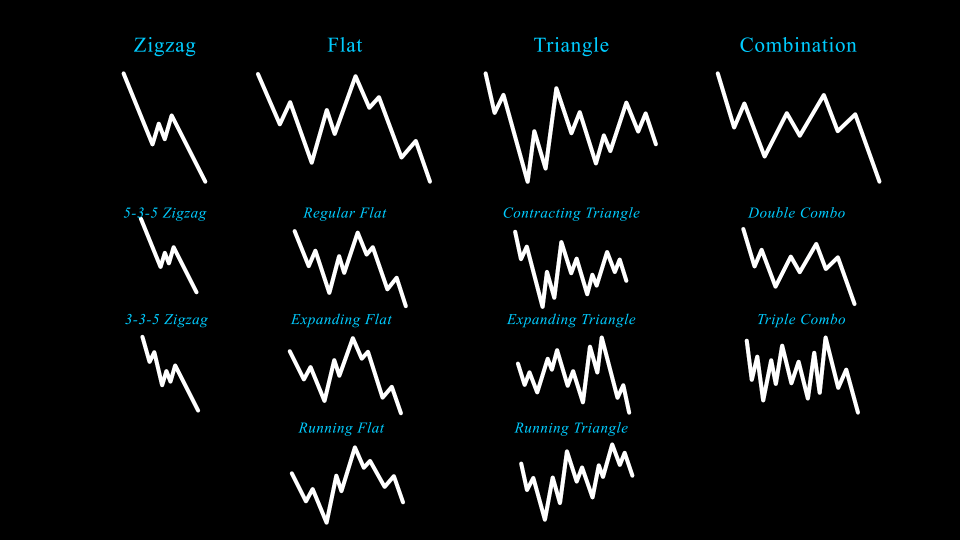
Overall, corrective waves can be grouped into four separate categories: zigzags, flats, triangles, and combinations. Within each category there are also distinct variations of each pattern that can be considered subsets of the larger category. The amount of variety displayed by corrective waves means that patience and flexibility must be exercised when analyzing them in real-time.
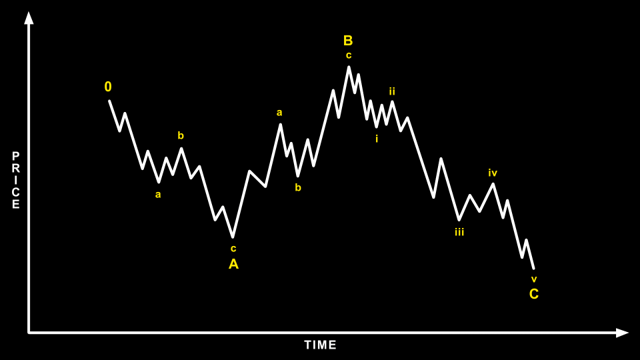
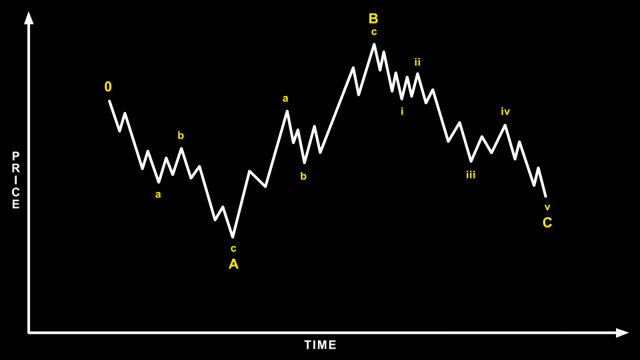
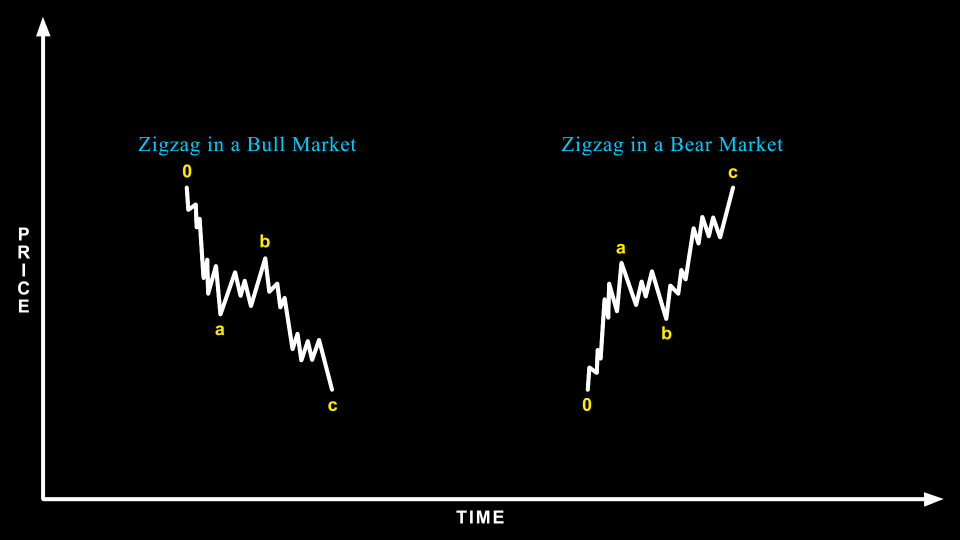
Zigzag
Zigzags fill the role of sharp and quick corrective waves. They often appear in the wave 2 position of a motive wave, fooling market participants into believing that the previous opposing trend is still in full effect. Zigzags can also be deceptively shallow though, leaving many market participants behind who were hoping for a deeper retracement.
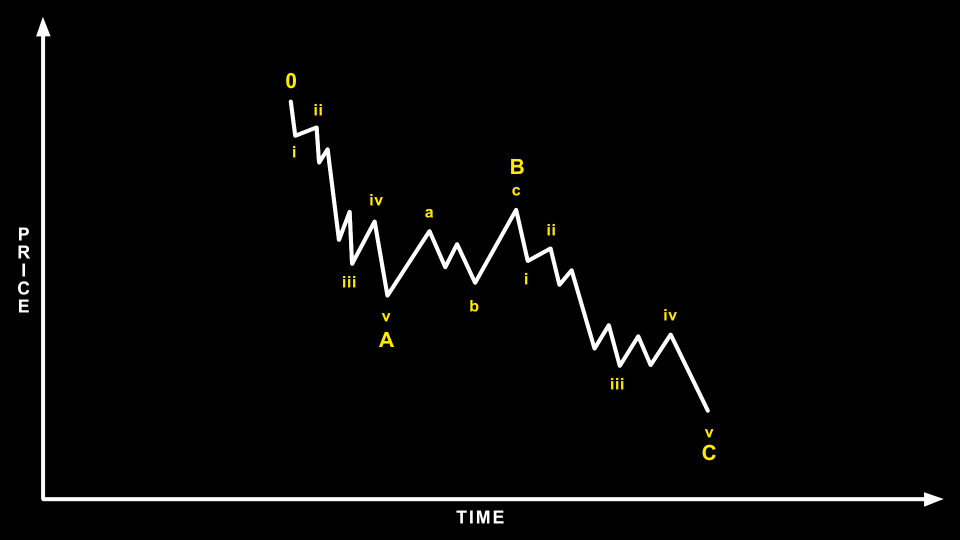
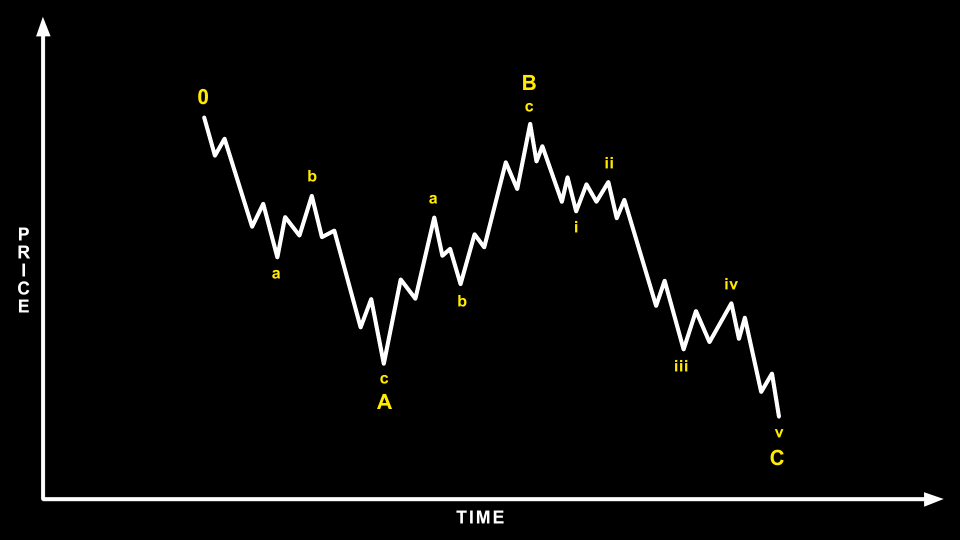
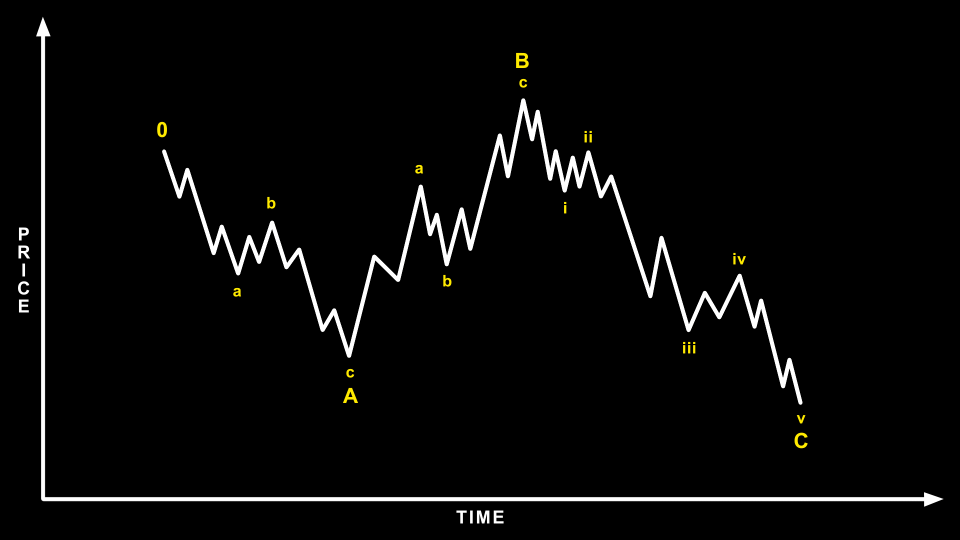
The widely adopted definition of a zigzag is a 5-3-5 substructure. However, my colleagues and I have encountered countless examples of corrections that otherwise display the same qualities as a traditional zigzag, but subdivide best as a 3-3-5 substructure. Therefore, we believe the qualification of a zigzag should be based on character rather than a strict subwave structure.

Because zigzags angle sharply against the underlying trend, the B-wave typically does not exceed a 50% retrace of the preceding A-wave, and will often be much shallower than that. The most common proportions of a zigzag are when wave A has a similar relative size to wave C. However, there are instances when wave C will be disproportionately larger than the size of wave A, as if trying to fill out an impulse but ultimately failing.
Flats
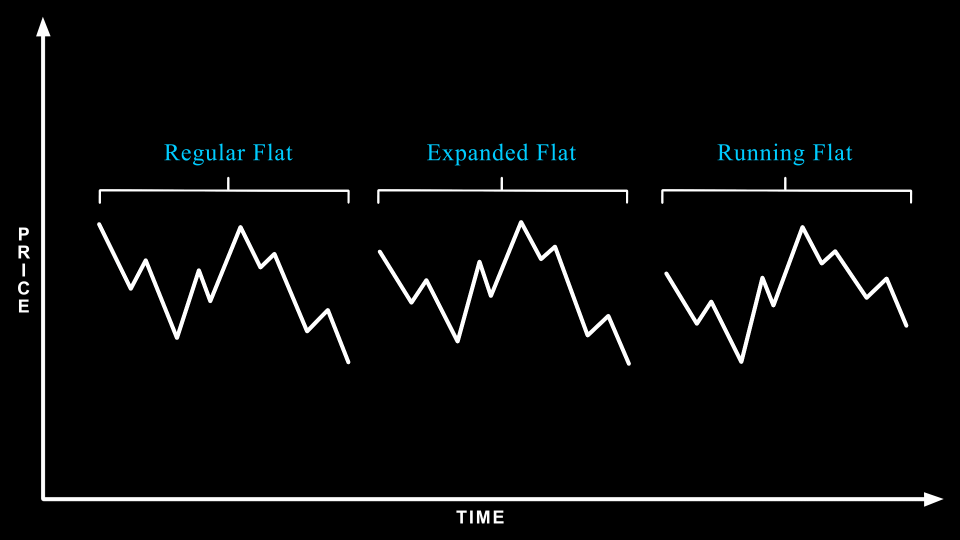
In contrast, flats fill the role of protracted and sideways corrections. They often appear in the 4th wave position of an impulse, frustrating market participants who grow impatient and act before the correction ends. Flats should subdivide as a 3-3-5 substructure, but there are a few rare examples when wave A takes shape as 5 waves. There are 3 varieties of flats: regular flats, expanded flats, and running flats.

Regular Flat
Regular flats are the standard variety, identified by the B-wave retracing most if not all of the preceding A-wave. Wave C will then typically terminate just beyond the end of the A-wave, often the same length as wave A in price. This behavior results in the sideways, protracted shape that is characteristic of all flats.
Expanded Flat
An expanded flat occurs when wave B retraces beyond the origin of wave A. This results in further progress made in the direction of the trend at one higher degree, implying a strong underlying trend since it’s being achieved by a corrective wave. Therefore, expanded flats generally precede or follow extended actionary waves, usually wave 3 of an impulse.
Running Flat
In rare instances, wave C of a flat will fail to reach the termination point of wave A. This is referred to as a running flat, and occurs when the underlying trend is so strong, the price structure is skewed in that same direction, despite being a corrective wave. Generally, running flats are accompanied by an expanded B-wave, but this is not a requirement.
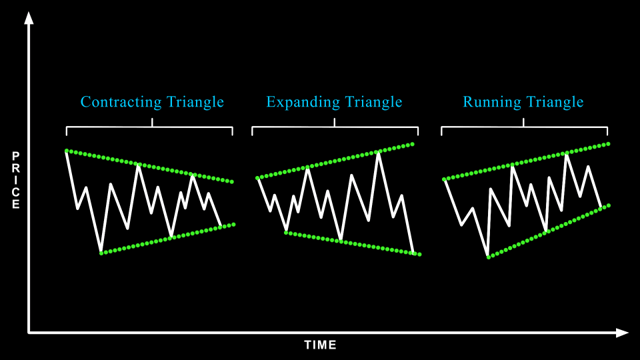
Triangles
In a similar vein as flats, corrective waves can also take shape as a triangle, exhibiting 5 overlapping subwaves, labeled ABCDE. Although diagonals have a similar definition, triangles do not typically progress price in the direction of the trend at one higher degree, but instead consolidate sideways and correct primarily through time rather than price. There are three varieties of triangles: contracting, expanding, and running.
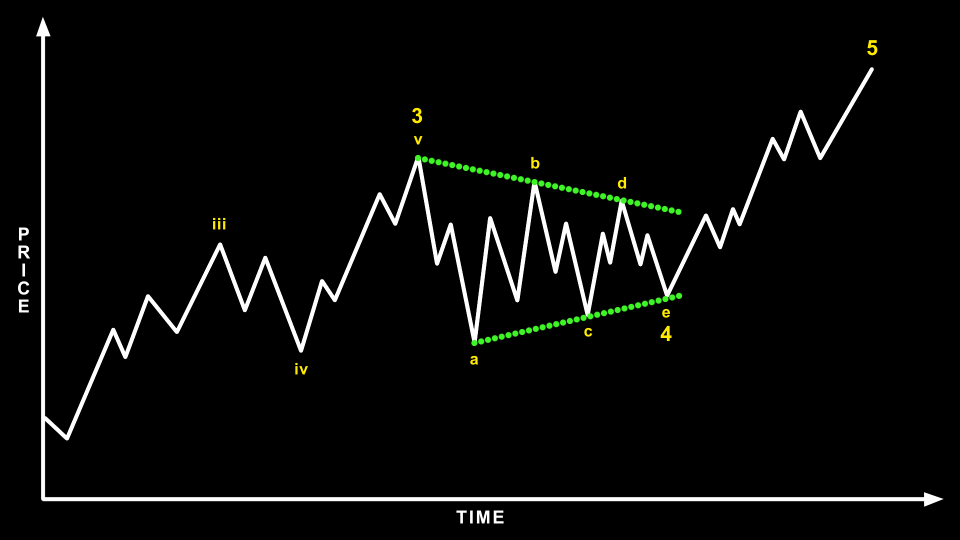
One important thing to note about triangles is that they do not appear in the wave 2 position of a motive wave. Instead, they precede the final actionary wave in a motive or corrective structure. Therefore, they appear as either a 4th wave if motive, or the B or X wave if corrective. When you encounter a triangle, it means that the trend at the current degree is likely coming to an end soon.
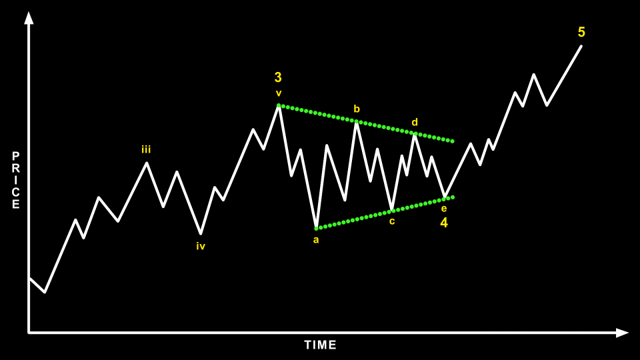
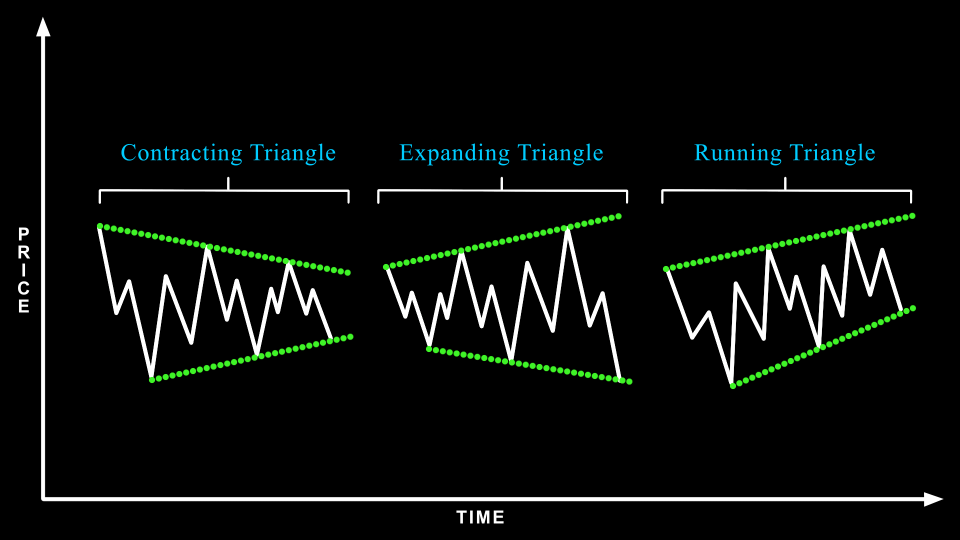
Contracting Triangle
Contracting triangles are the most common variety, characterized by converging trend lines that connect the price extremes of each subwave. The subwaves of triangles typically form as zigzags or flats, but occasionally a combination structure may be encountered.
The B-wave of a contracting triangle will sometimes exceed the origin point of wave A, similar to and expanded flat, typically when there is a strong underlying trend. The E-wave of a contracting triangle also has a tendency of avoiding the trend line, either completing shy of reaching there or overshooting it without violating the price extreme of wave C.
Expanded Triangle
Expanded triangles are much less common than the contracting variety, and are characterized by diverging trend lines that connect the price extremes of each subwave. Once again, the subwaves typically form as zigzags or flats, but occasionally a combination structure may be encountered. The E-wave of an expanded triangle tends to fail reaching its respective trend line, while still exceeding the price extreme of wave C.
Running Triangle
Running Triangles are the rarest variety, occurring when the underlying trend is so strong that the overall structure is skewed in the same direction, similar to a running flat. The trend lines connecting the price extremes of each subwave will either be contracting or parallel, but both sloping in the direction of the underlying trend.
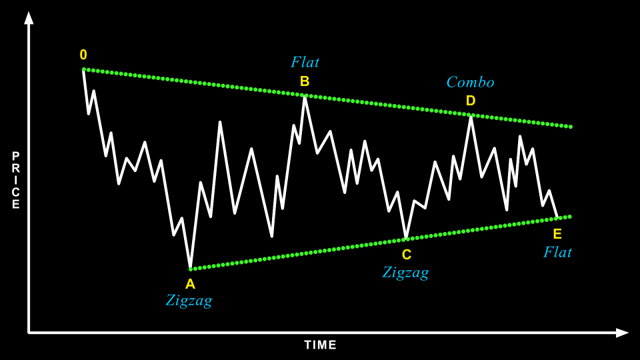
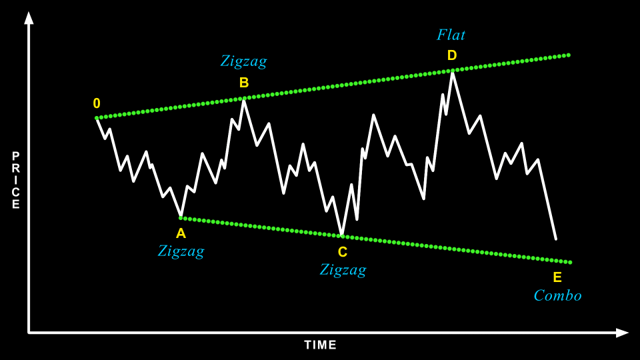
Combinations
Combination structures are an odd bunch. From afar, they often look nearly identical to their ABC counterparts. However, when examined up close, their substructure looks flawed and inconsistent with standard expectations. They are difficult to anticipate in advance and are typically only identified once the majority of the pattern has already filled out.
Our expectation going into any correction is that it will develop as one of the more common varieties (zigzag, flat, or triangle), so combinations are usually only adopted when price begins to deviate from those expectations. This typically occurs when what would normally be the C-wave of zigzag or flat does not fill out the final 4th and 5th wave.
Combinations come in two varieties: a double combination and a triple combination. The latter is less common, but as their name suggests they are composed by a combination of zigzags, flats, and triangles. They also carry a different labeling than other corrective structures, using WXY for double combinations and WXYXZ for triple combinations.
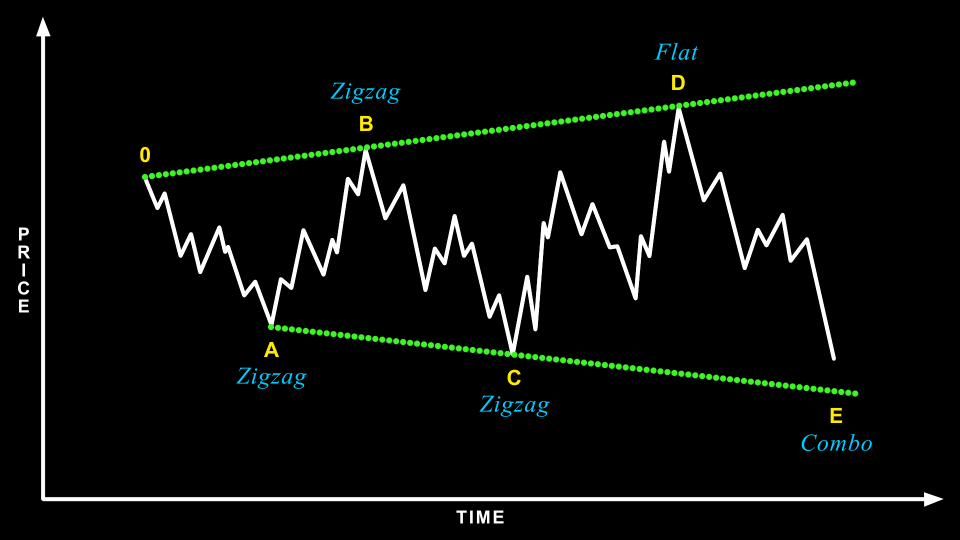
Double Combo
Double combinations are composed of two corrective patterns, separated by another corrective patterns in the opposite direction. Each wave can either be a zigzag, flat, or triangle, but a triangle will only ever appear in the X-wave or Y-wave position. There should only be one triangle per double combination.
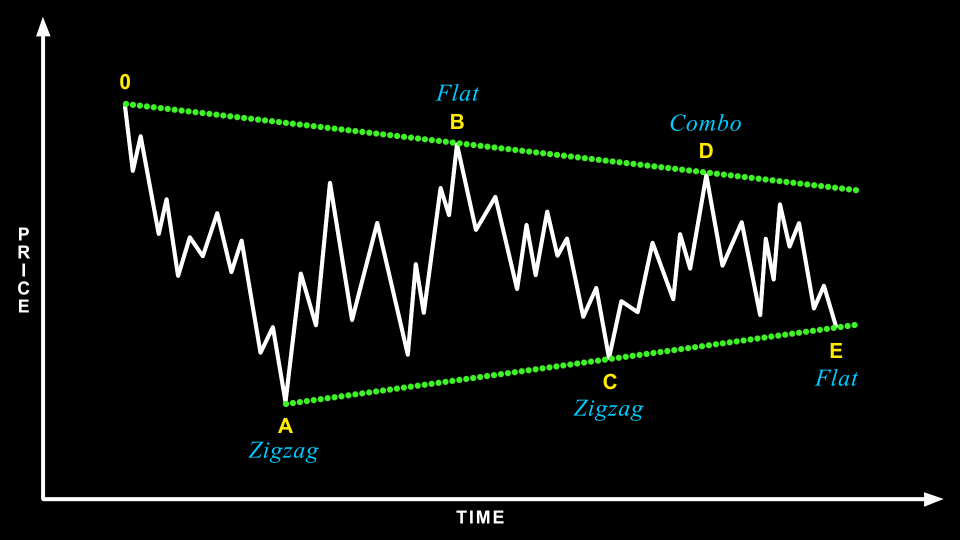
Triple Combo
Triple combinations are composed of three corrective patterns, separated by another two corrective patterns in the opposite direction. Each wave can either be a zigzag, flat, or triangle, but a triangle will only ever appear in the X-wave or Z-wave position. There should only be one triangle per triple combination.
