Bulls stepped up today
 By
By
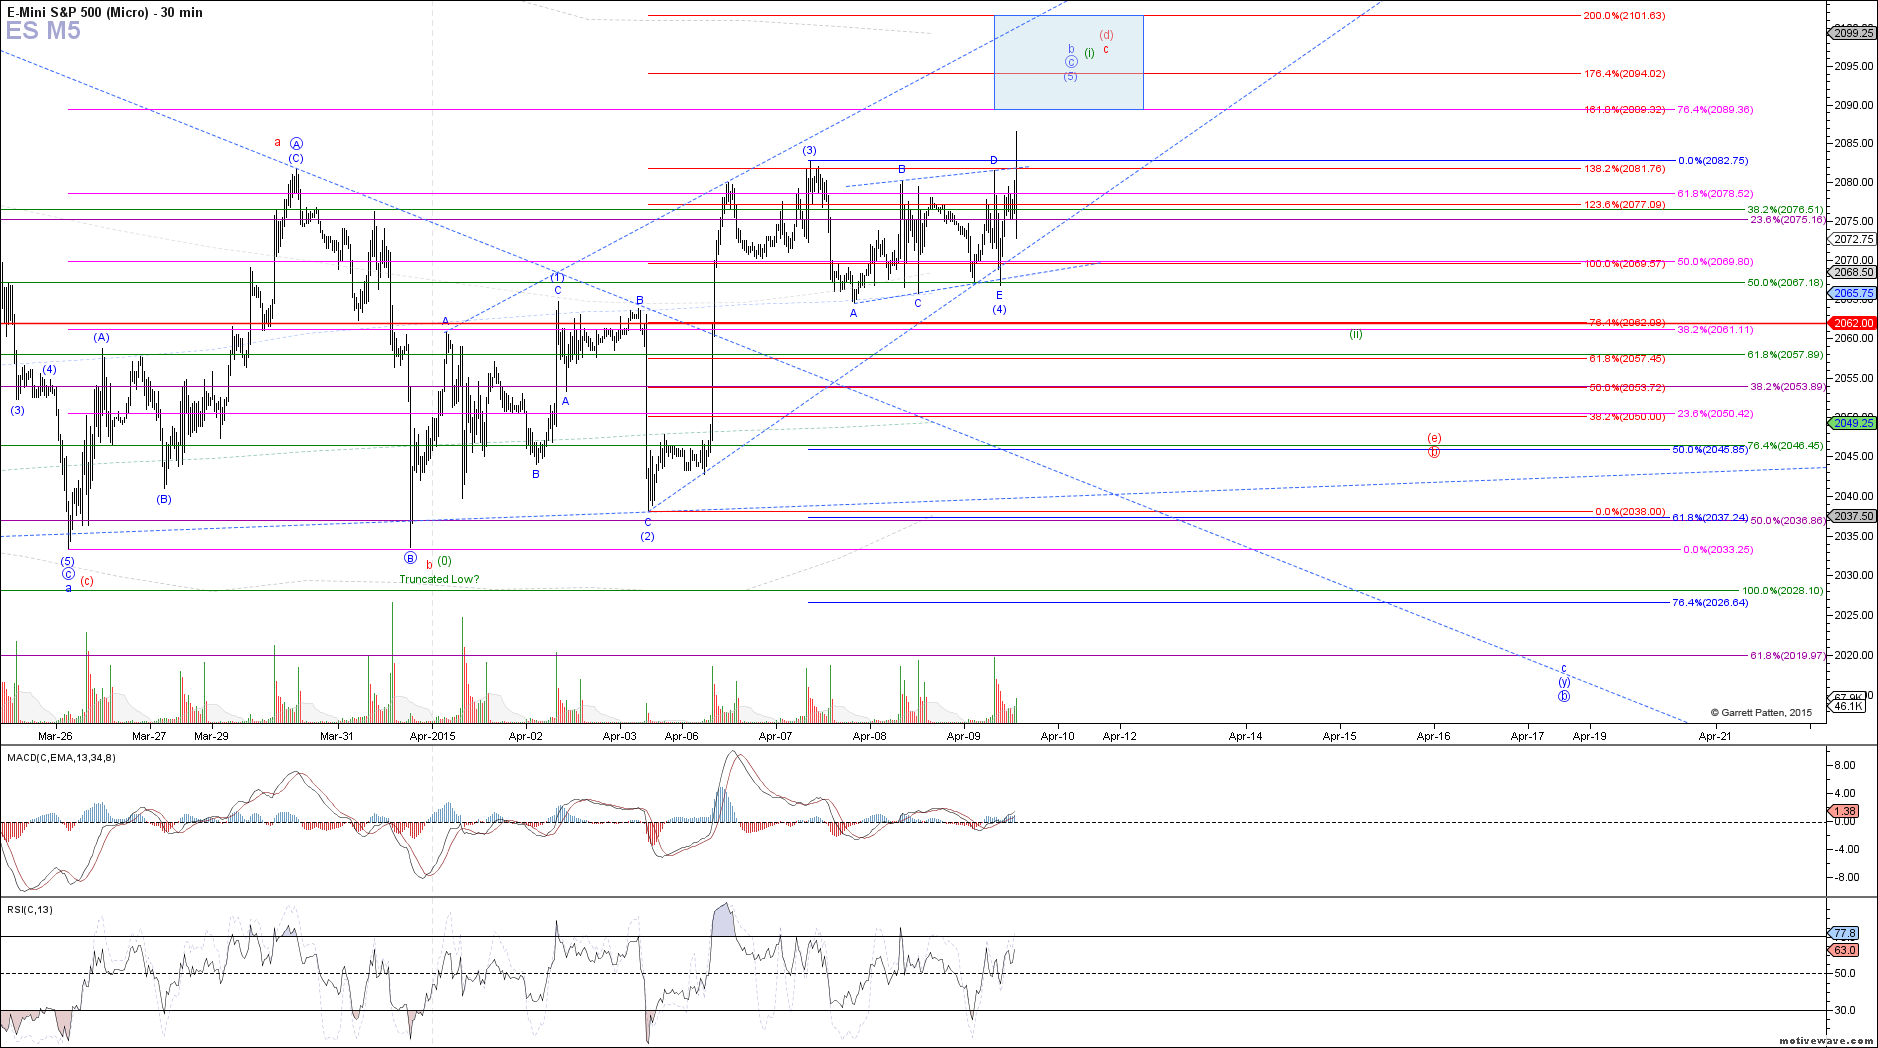
The ES followed expectations today, breaking out of this trading range to the upside in what should be a 5th wave in a diagonal structure off of last week's low. Price should now head to the 2089 - 2094 target region, although I have extended the top side of the blue box to 2102 in case of an extension, although I am not necessarily expecting that. If long, I would consider taking profits or hedging in the 2089 - 2094 region, since all of the most likely counts at this time point to some sort of pullback from there.
The red count remains the same, as the (d)-wave of a large b-wave triangle off the February high, leading to a turn down in wave (e) next. The red (e)-wave would take price back towards the March and April lows, but not breach them, likely at least to the .764 retrace of this diagonal structure off last week's low.
The blue count is still valid, just with a higher b-wave, and the potential for a c-wave to take price back below the March lows for a final bottom. I would need to see a clear 5 waves down off this next high as wave 1 of c in order to expect that though, since I think that the red count has better chances now of playing out.
Finally, for all the eager bulls out there, there is an outside chance that last week's low was actually a truncated low of the larger b-wave consolidation off the February high, and we have started the next rally phase towards new all-time highs. That would suggest that the diagonal off last week's low was actually a leading diagonal, as wave (i) of c, and the next pullback will be a corrective wave (ii). In this scenario, the next pullback would be the shallowest, but should reach at least the .382 retrace (we can't calculate exact targets until the 5th wave of the diagonal tops).