Bears grabbed the ball today
 By
By
After topping in our expected resistance region yesterday, the ES dropped overnight to the support region identified between 2066.50 - 2060.50 ES. Price tried to stage a bounce off that support today, and it continues to hold it as of typing this update, but the manner in which price bounced does not instill a lot of confidence that price will be able to follow through to a new high from here to complete 5 waves off last week's low in the blue count.
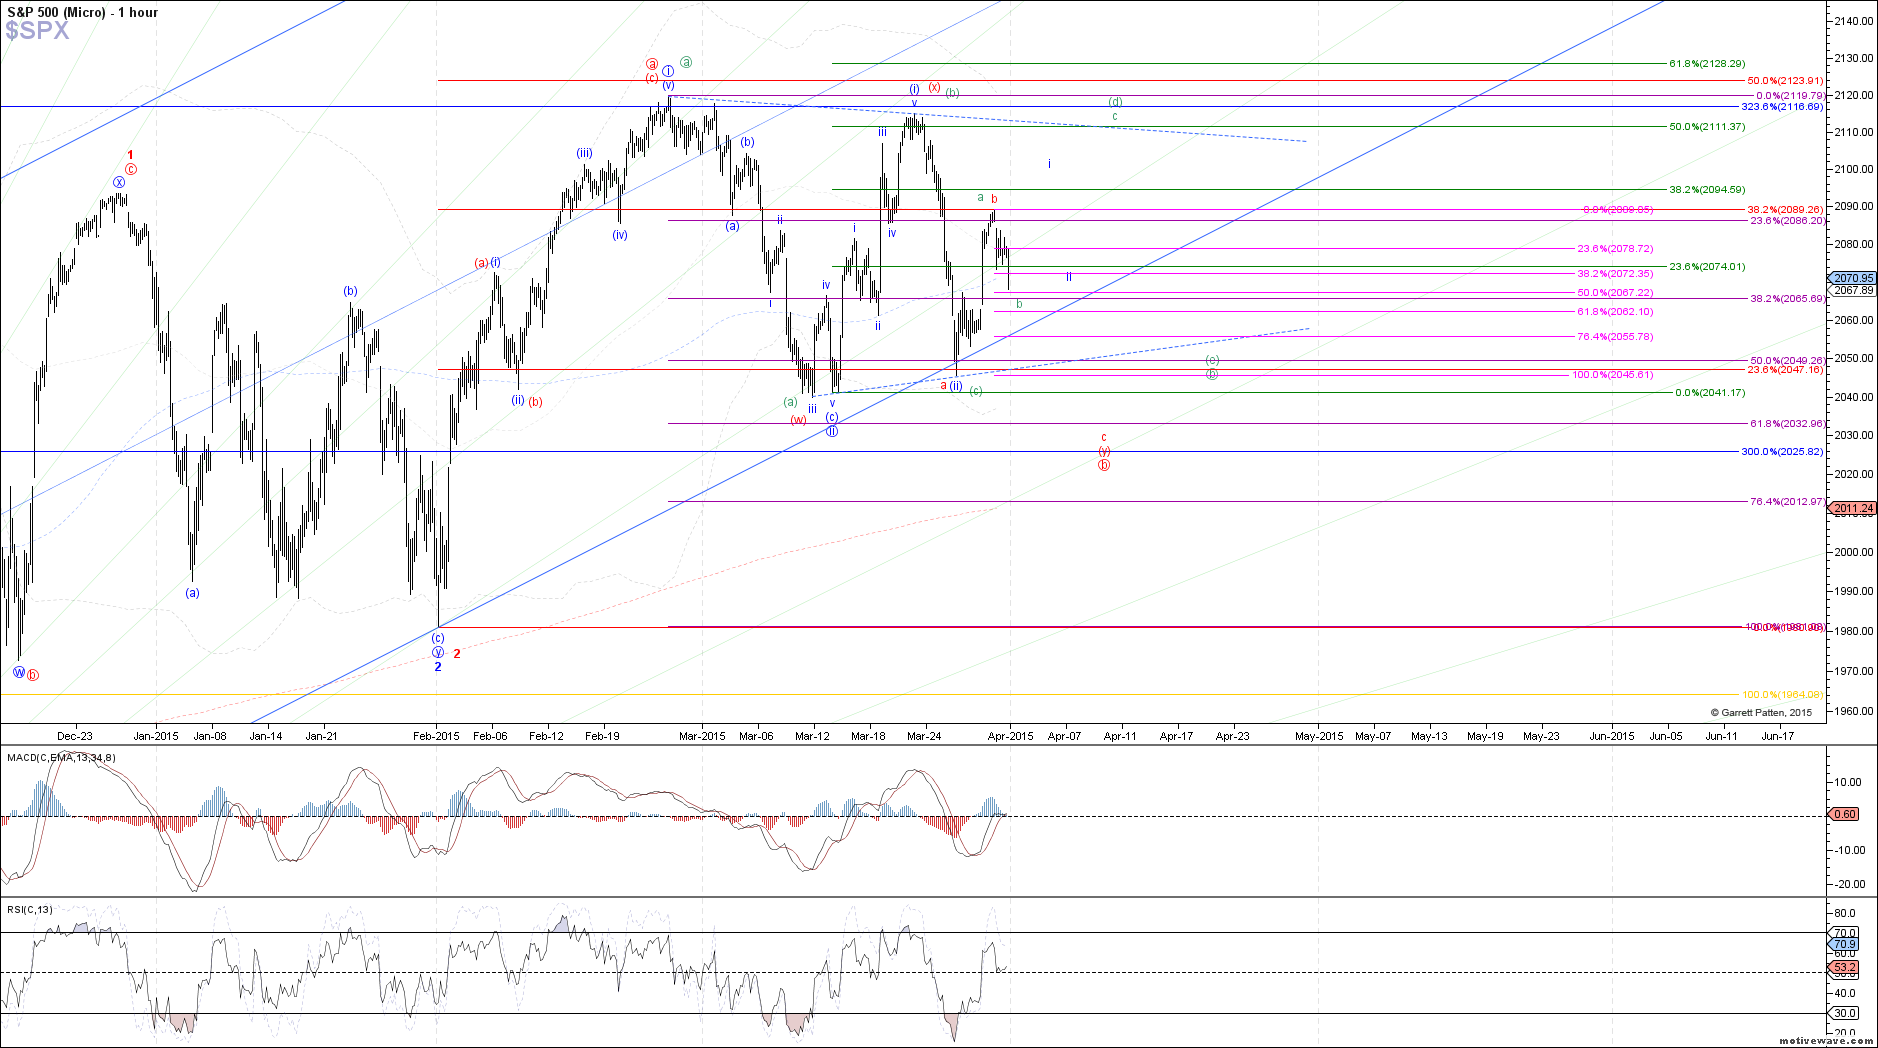
Instead, price appears to be taking the path of the bearish red count, which can carry price down to a new low from here with 2033 SPX (2027 ES) as the initial target. If that path plays out, it would likely count as red wave c of (y) to complete a larger b-wave or wave ii off the February high. It would be nice to see 5 waves off of yesterday's high as wave 1 of red c to confirm this, but not required if the structure is going to trace out as an ending diagonal instead.
However, before committing to the red count as the definite path here, please keep an eye out for retrace support from the bounce off last week's low (shown on my SPX chart by the pink fibs). If price were to find support between the .500 and .618 retrace (2072.35 - 2062.10 SPX), this drop off yesterday's high can still easily be corrective as a b-wave in the green count, leading to a c-wave back up to complete wave (d) of the potential b-wave triangle.
Overall, I believe that focus should remain on the bigger picture count for those who are swing-trade oriented, while using scalp opportunities as a means to hedge. We are still expecting a bottom later this month that should lead to a breakout to new all-time highs this spring.