Another important inflection point
 By
By
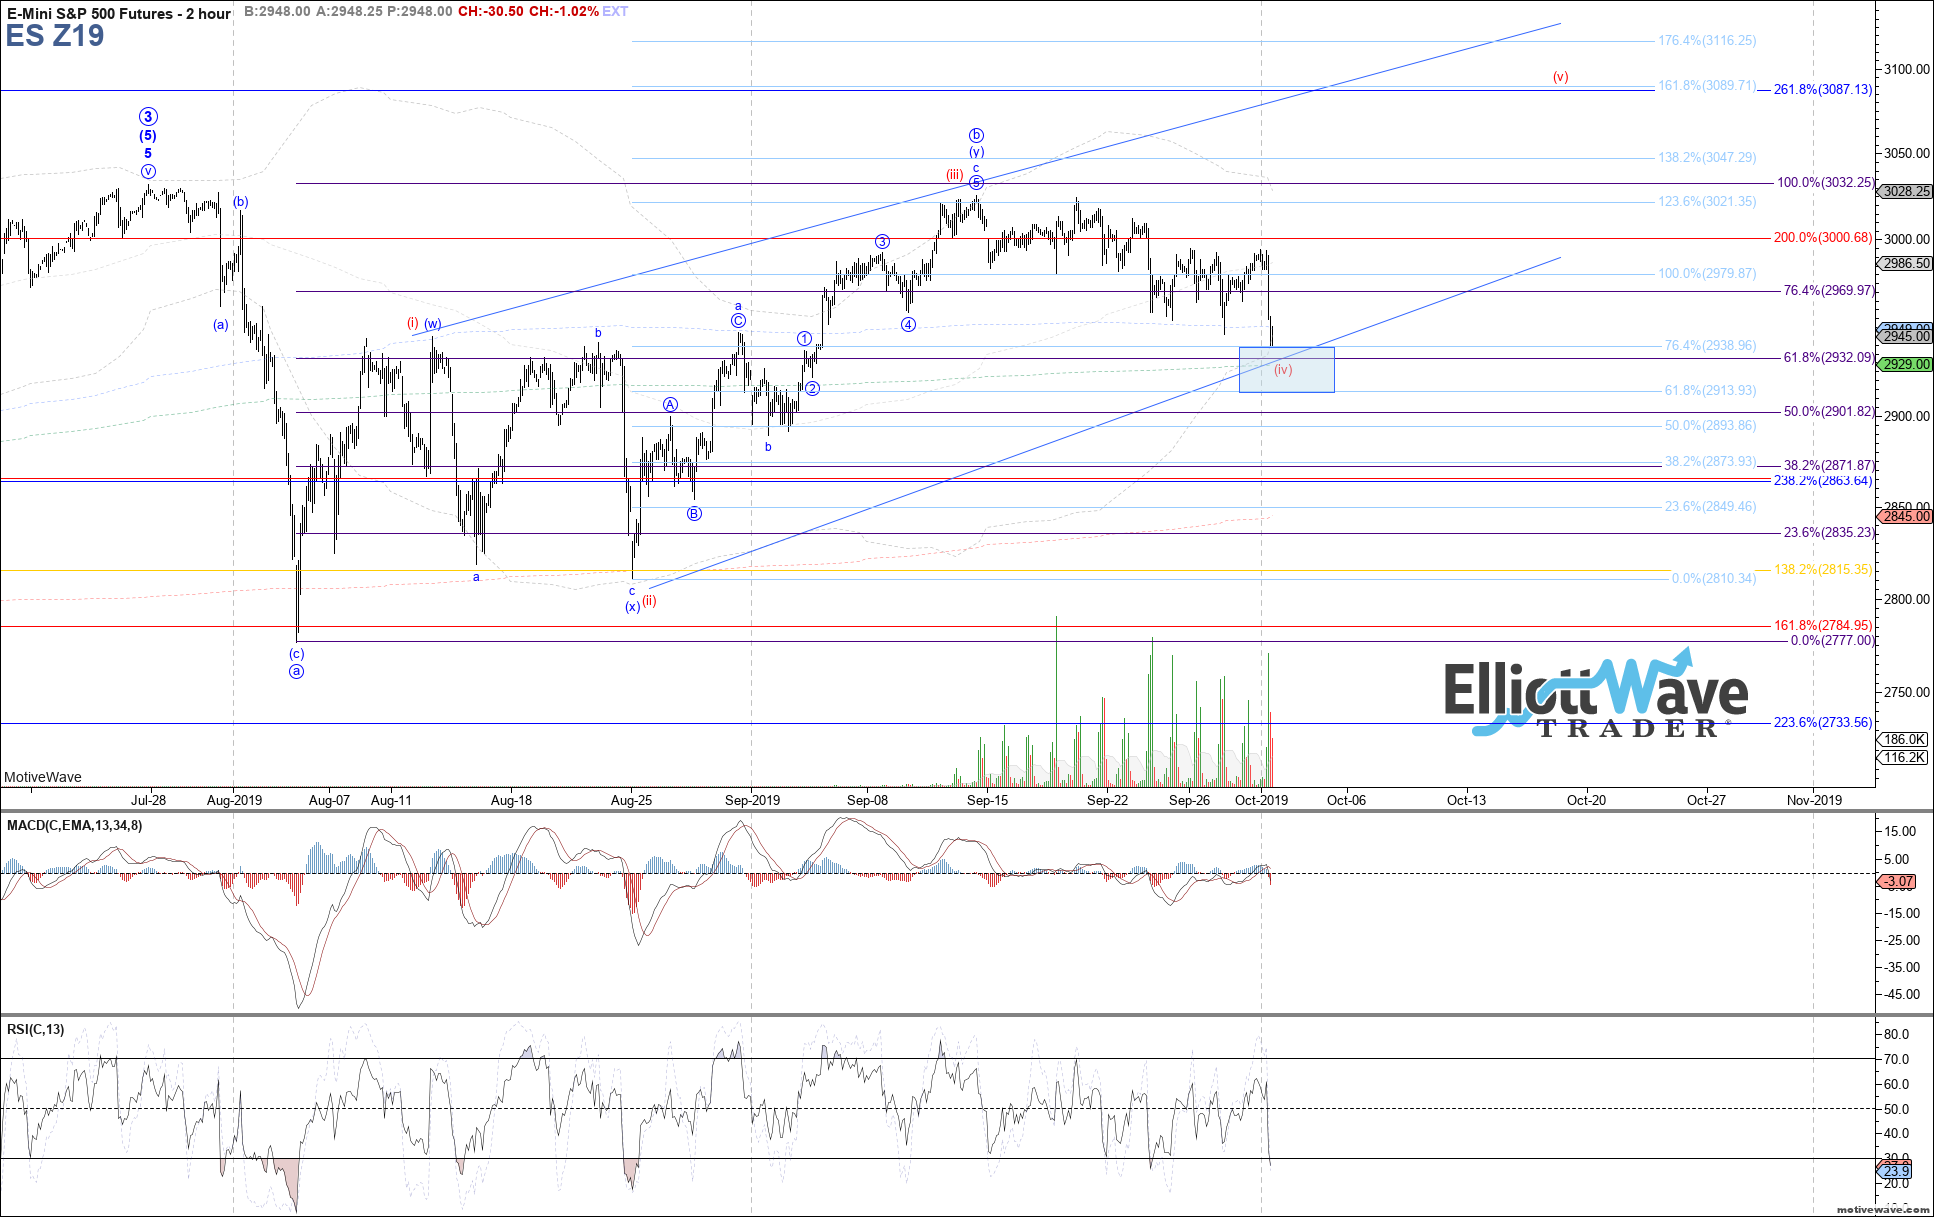
The market dropped sharply lower today, undercutting the low made at the end of last week. Therefore, our attention is once again turned to the 2 hour chart, and the support region between 2939 - 2914 as the last chance for a corrective pullback off the September high to hold as wave (iv) of the bullish alternative as an ending diagonal off the August low shown in red.
Price would need to turn back up above today's high at 2994 in order to firmly place probabilities in favor of continuing on toward a new all-time high as red wave (v), at which point 3090 would be the overall target above that would likely be reached before attempting another top.
Otherwise, any break below 2914 is now our signal level to start confirming a more significant top already in place as wave b of the blue count, and price heading back down to at least retest the August low and potentially much lower in a c-wave.
With the amount of overlap that we have in the decline off the September high, it is difficult to suggest a clear edge for one potential outcome over the other, but we will likely get a better idea as more of the price structure fills out and we see what the next larger bounce looks like.