SPX and p-values
 By
Leo Valencia
By
Leo Valencia
So it was a down day with constant selling pressure and volume picked up a lot from previous sessions. Even though the drop is only about 0.84% which looks like nothing out of the ordinary, it is good to analyze it in the context of recent action.
For those of you that know me, you know that I like to use statistical methods to extract meaning from price action. In particular I like to analyze the returns instead of absolute price (and even more concretely, the log returns = log(today's close/ yesterday's close)). The log returns can be treated as random variables and we can compute a bunch of interesting statistics from the distribution of past log returns.
In this case I want to compute something called a p-value, which is connected to the likelihood of seeing a particular log return more extreme than the one we just got when assuming a default hypothesis (we can call that the null hypothesis). In this case our null hypothesis is that the market is in the same regime it has been for the last several sessions (we can use 20, or 5, to represent four weeks, or one week of price action). So when I do something like that for today, the p-value for the last 5 sessions before today is around 0.014. In other words the odds that today's action is part of the previous five day distribution are 1.4% which are very low (extreme low), doing the same for the past 20 sessions the p-value I get is: 0.021, in other words the odds are only 2.1% that today's action are part of the same distribution that we have seen in the last 30 days (equivalent to 20 sessions).
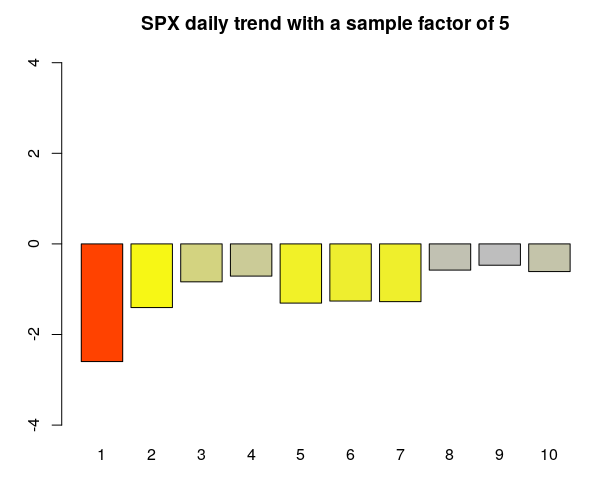
For those of you familiar with p-values, you might know that a p-value less than 0.05 means we can reject the null hypothesis with a good deal of confidence (Social and economic sciences use 0.05, physics uses 0.01 or even less). Now, this is only one data point but it is an early sign, a proverbial monkey wrench that might signal the end of the current regime. In the attached chart you can see the 1 day return in red, but the 2, 3, and higher daily returns are down but still within the statistical limits of the null hypothesis. The implication is that now the bullish thesis completely depends on the action tomorrow (and the next few sessions) if the p-values start to come up below 0.05 for them we could claim the end of the current trend (low volatility with positive average returns).