Expected ATM level from Option Prices
 By
Leo Valencia
By
Leo Valencia
Option prices provide many clues about future expectations of volatility but what about future expectation of prices ? Can option prices give us hints of the expected terminal distribution for each expiration date ?
In principle they can, however remember that options are priced based on a risk neutral world. What this means is that option dealers don’t care about the absolute price of the underlying security but instead they assume that price will drift at the rate of the cost of carry (interest and dividends). The reason that option dealers can do this is because they can hedge away the real price moves of underlying so the only thing that remains after that hedging is the cost of carry drift.
This presents a problem because if we use option prices to derive a terminal distribution we’ll end up with the expected neutral risk distribution which of course never maps into the real world distribution. The easiest way to visualize the disconnect is by assuming risk free rate =0, dividends =0 in this idealized world (not that far from our current regime), the total drift of the underlying is 0, so option dealers assume that the the underlying will most likely end where it is right now and the distribution will only reflect the expected variance around that level. This is very unrealistic because in the market there are always trends going on, in other words some underlyings trend strongly upwards or downwards, however because dealers can hedge away the trend they don’t care so they assume that price will remain constant.
In the other hand we care a lot about those trends because as retail traders we don’t have the resources to continuously hedge the natural drift away and also because precisely we want to be completely exposed to that directional risk (as a source of profit for our positions).
The good news is that even though options are priced in a risk neutral world, they “leak” information about the expected real terminal distribution because we can construct binary options out of them. Remember that a binary option is a pure bet on the odds that price will be above certain level (for binary calls) or below certain level (for binary puts). So if we know the prices of binary options for all strikes we can know completely the expected terminal distribution of the underlying.
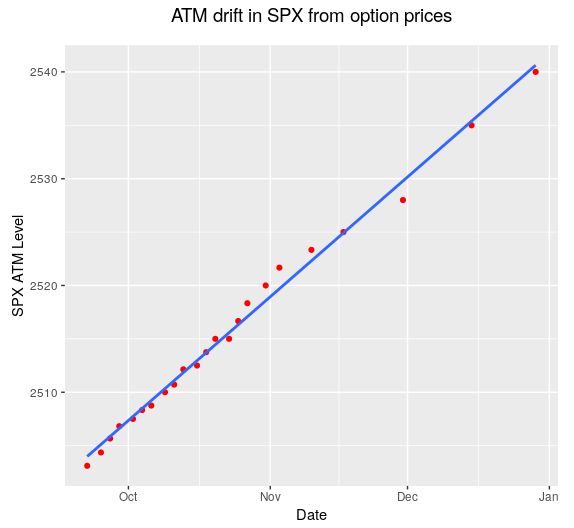
All this lengthy introduction is just to present a new chart which I call the ATM drift in SPX from option prices. The chart basically shows you the ATM level expected at different expirations from binary option prices. This is done by finding the strike of a binary SPX call with price of 0.5 (exactly 50% odds of ending ITM) because that is the definition of the final ATM level. As you can see from the chart option dealers are smarter that they look and they are in fact pricing a strong trend up in SPX right now. You can see that they expect SPX to have a natural drift towards 2540 by Dic 31 for instance. You can also see that the drift rate seems to be higher until the beginning of Nov and then it slows down a bit for that last two months.
The chart is also helpful when designing neutral trades because you can pick the natural drift level expected for the duration of the trade, so instead of using the current ATM level we use the expected ATM level at the future as our neutral reference. Finally by comparing the slope of the blue line (just a linear fit) at different dates we can see how the expectations of drift rate are changing over time, if we see the slope coming down then it means option dealers are expecting less upside.