Charts on S&P 500 (INX)
See below two daily SPX charts by Avi, the top one from December 10, 2016 and the bottom from April 3, 2017, indicating how the S&P 500 closely followed his projected 3rd wave path.
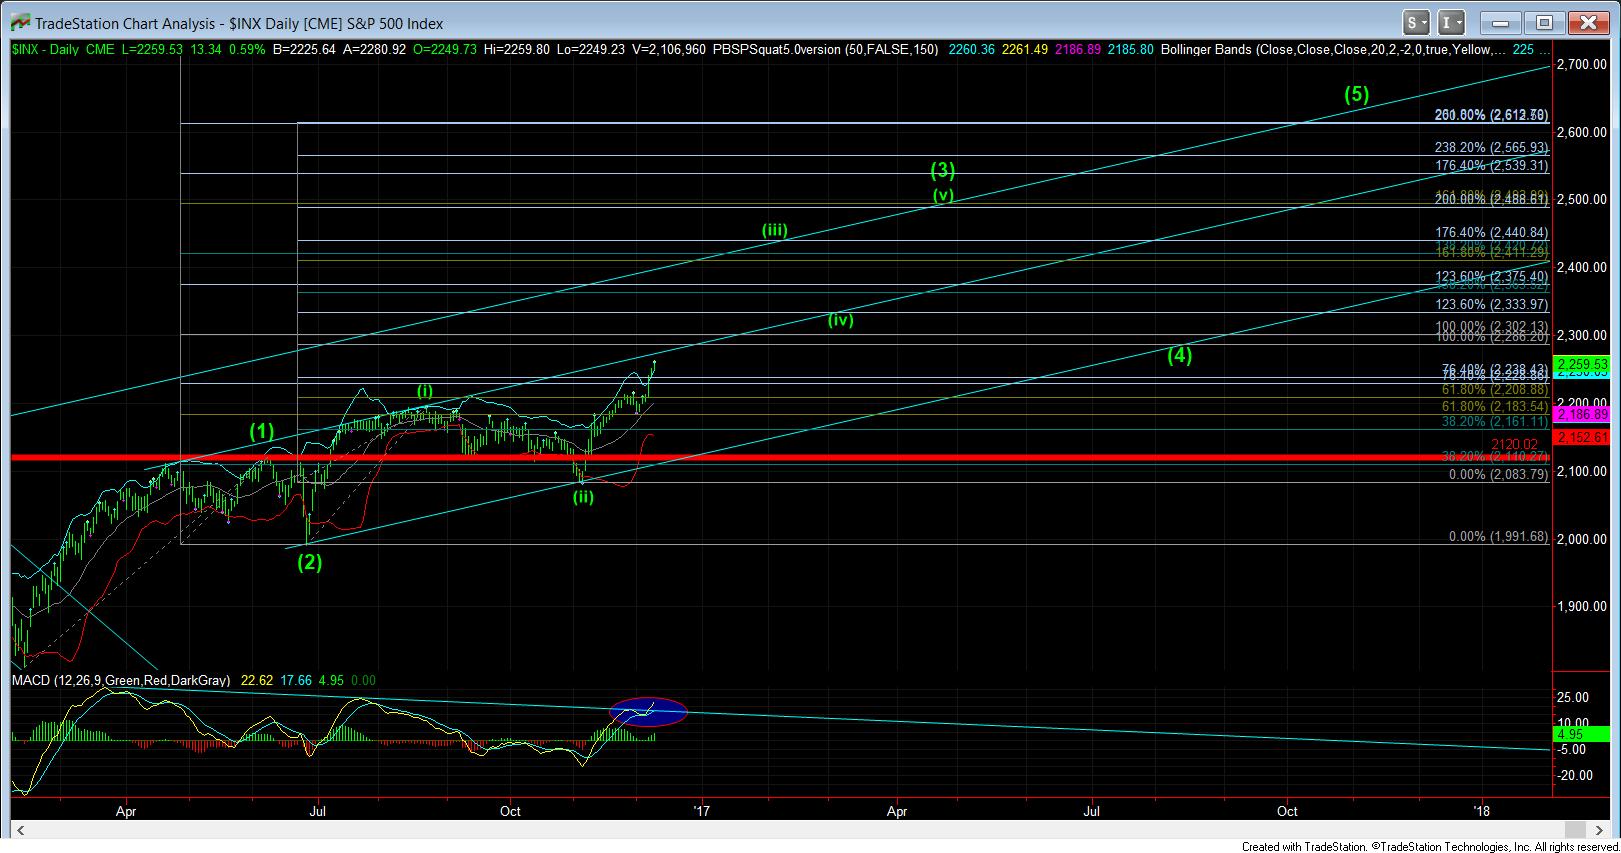
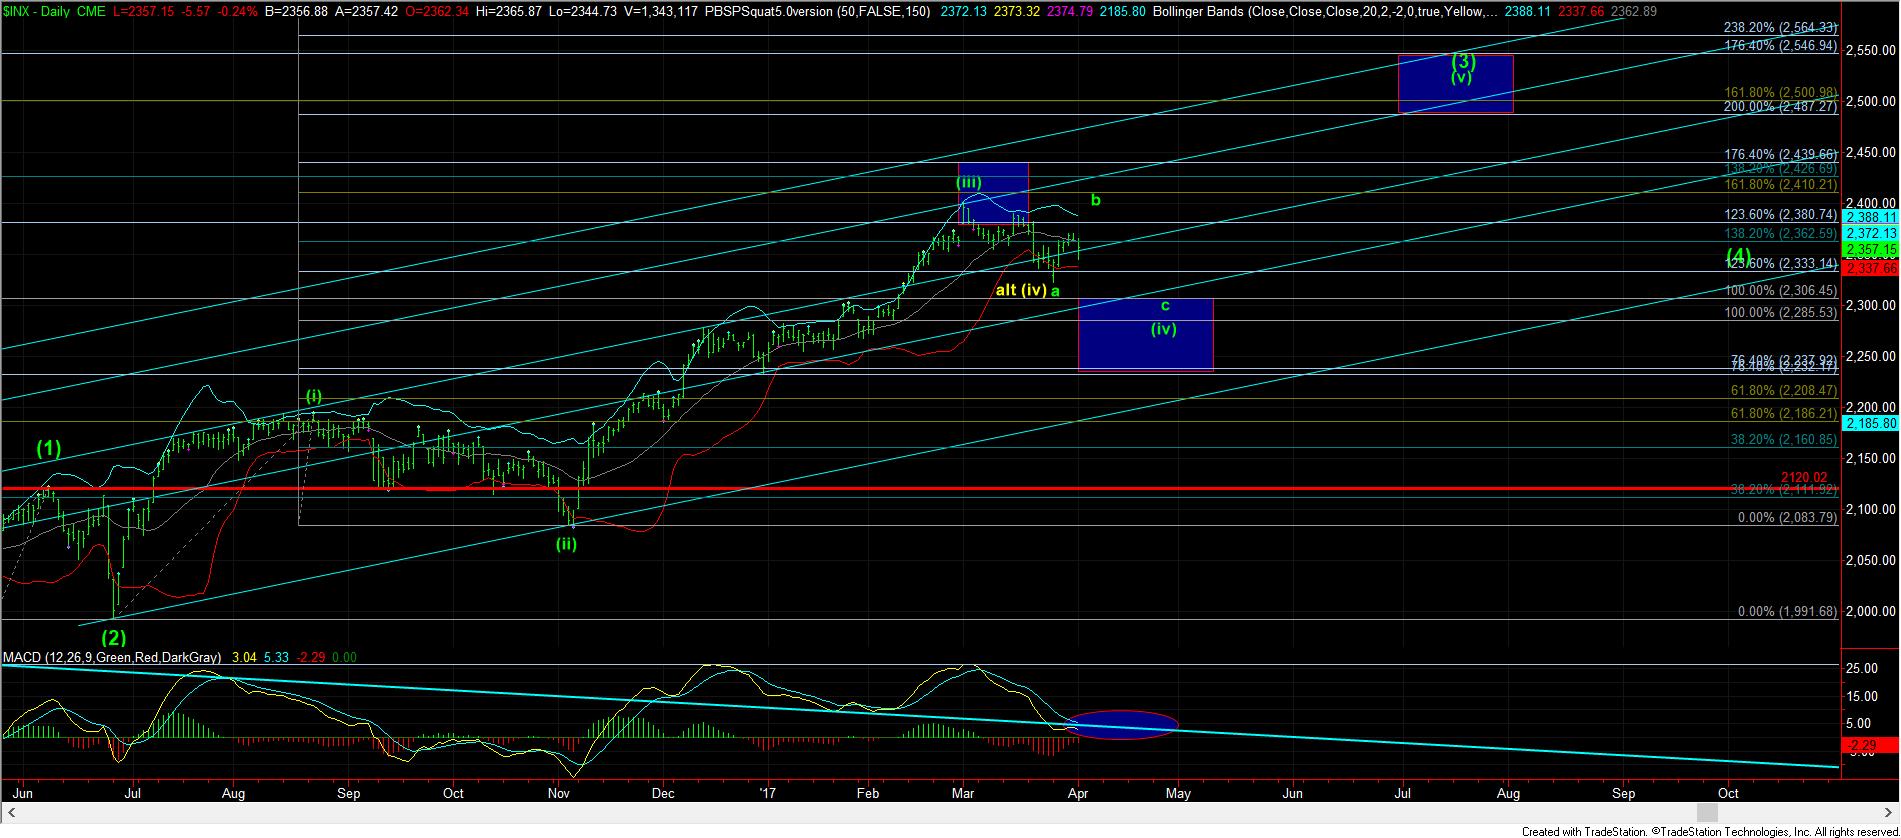
See below two daily SPX charts by Avi, the top one from December 10, 2016 and the bottom from April 3, 2017, indicating how the S&P 500 closely followed his projected 3rd wave path.

I live Finance. 80hrs a week corp finance. I trade as a hobby and in my opinion this is the best site in the world for someone to learn about markets... i rue the day when it is no more or its core is changed. there is NO BETTER SITE IN THE WORLD to get the off-cuff input/feedback/knowledge across ALL MARKETS like this site... Thank you to the analysts here who grind out thousands of charts each week."GibsonDog" - Trading Room
My AUM has grown exponentially because of you and I can't thank you enough. My biggest regret is not signing up sooner! You've done more good than you will ever know."AAMilne" - Trading Room
I worked on trading desks at top investment banks for 10 years, then traded on my own for another 8. I've seen 100s of research from the best analysts in the business. Avi and EWT is the only one I'm willing to pay for right now."tzeyi" - Seeking Alpha
I see the best quants, strategists and technicians the street has and you and your group are amongst the absolute best. My trading desk is floored at turning levels you are able to provide."Slu" -
CNBC had a stat this morning that over the last 20 years 86% of money managers/hedge funds have underperformed the market. They couldn't figure out why that’s the case given how 'smart' these people are. . . . I know my performance since joining the site has skyrocketed!"HenryH" - Trading Room
I've been managing money since 1981 and ... I've never seen anyone handle fibs like him [Avi]."halburris" - Seeking Alpha
This is literally the greatest advisory service - bar none."MJK" - Trading Room
Avi, After 40 years of trading...I am convinced there is no better analysis than yours."jmt1951" - Seeking Alpha
I’m convinced, EW theory is THE best way to approach markets for investing/trading. Whether you’re scalping micro moves, day trading swing trading or long term investing, EW always has you covered. Most people have a lens or a way they view the market but how consistent over time is it? For myself I like fractals and have made life changing trades off them. But as my trading days add up [and] the value of EW becomes clearer, especially when coupled with fib #s, I have to give credit to you Avi for this!"bullhammer" - Trading Room
"I'm approaching my one year anniversary in the group and I truly believe this is the best decision I have ever made about a research service. FWIW, I'm a financial advisor and I have been in the industry for over 20 years. I manage over 300MM in assets and have routinely been a council member at every firm I have ever been with. Even though I'm just scratching the surface in my Elliot Wave education, this service has really helped me position my clients in the right way.""YogiZeke" - Trading Room