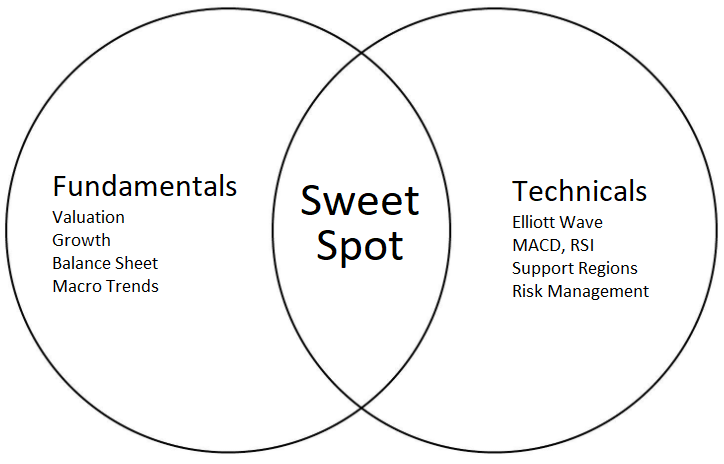
Where Fundamentals Meet Technicals
 By
By
Once per week in Stock Waves, I publish a piece called “Where Fundamentals Meet Technicals” that takes a look at various stocks or asset classes where my fundamental analysis aligns with the technical analysis from Zac and Garrett, either bearishly or bullishly.
Occasionally, like this one, I publish one of them publicly as well.
As someone who is 95% fundamental-focused with a long-term view, I’m willing to buy an investment that I think is underpriced, and let it play out for years, which is a rather tax-advantaged strategy. It does, however, help to have a price confirmation, momentum indicators, and other positive technicals on your side as well, so that you don’t waste a ton of opportunity cost waiting for something to play out when there’s bullish action going on elsewhere.
Investors all have different time horizons and investment processes, and I view technical analysis as a risk-management tool. Sometimes my fundament analysis points in one direction, while the technical analysis points elsewhere, and other times, they point in the same direction. Those intersections are what I highlight in this weekly series.
This issue of “Where Fundamentals Meet Technicals” looks at stocks and commodities.
Costco
Let’s start with the bearish potential first before we move onto some of the bullish potentials.
Costco (COST) is a great company, the economic moat is extremely wide, and the fundamentals look strong. Unfortunately, the valuation became so high, that it looks a lot less attractive going forward, and is ripe for a correction or consolidation until fundamentals catch back up with price. Berkshire Hathaway (BRK.B) sold their entire position in Costco stock last quarter.
The stock has historically traded at a rich valuation of about 25x earnings. However, it’s currently trading for over 40x earnings, which gives them a dividend-adjusted PEG ratio of about 4x, which is rather high:
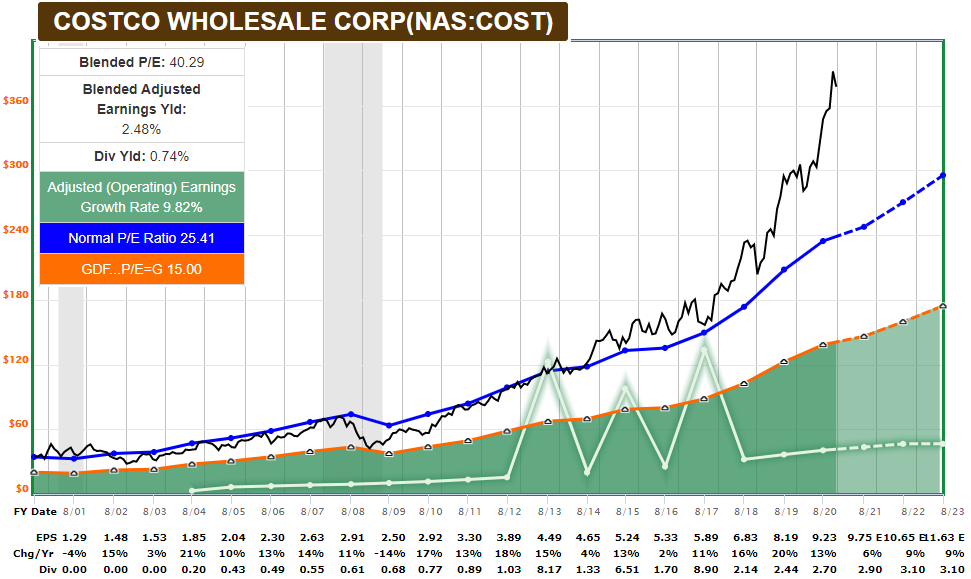
Chart Source: F.A.S.T. Graphs
So, it’s interesting to see Garrett, who doesn’t monitor valuations or fundamentals, chart it as likely to climb a bit higher and then experience a notable correction, from a purely technical point of view:
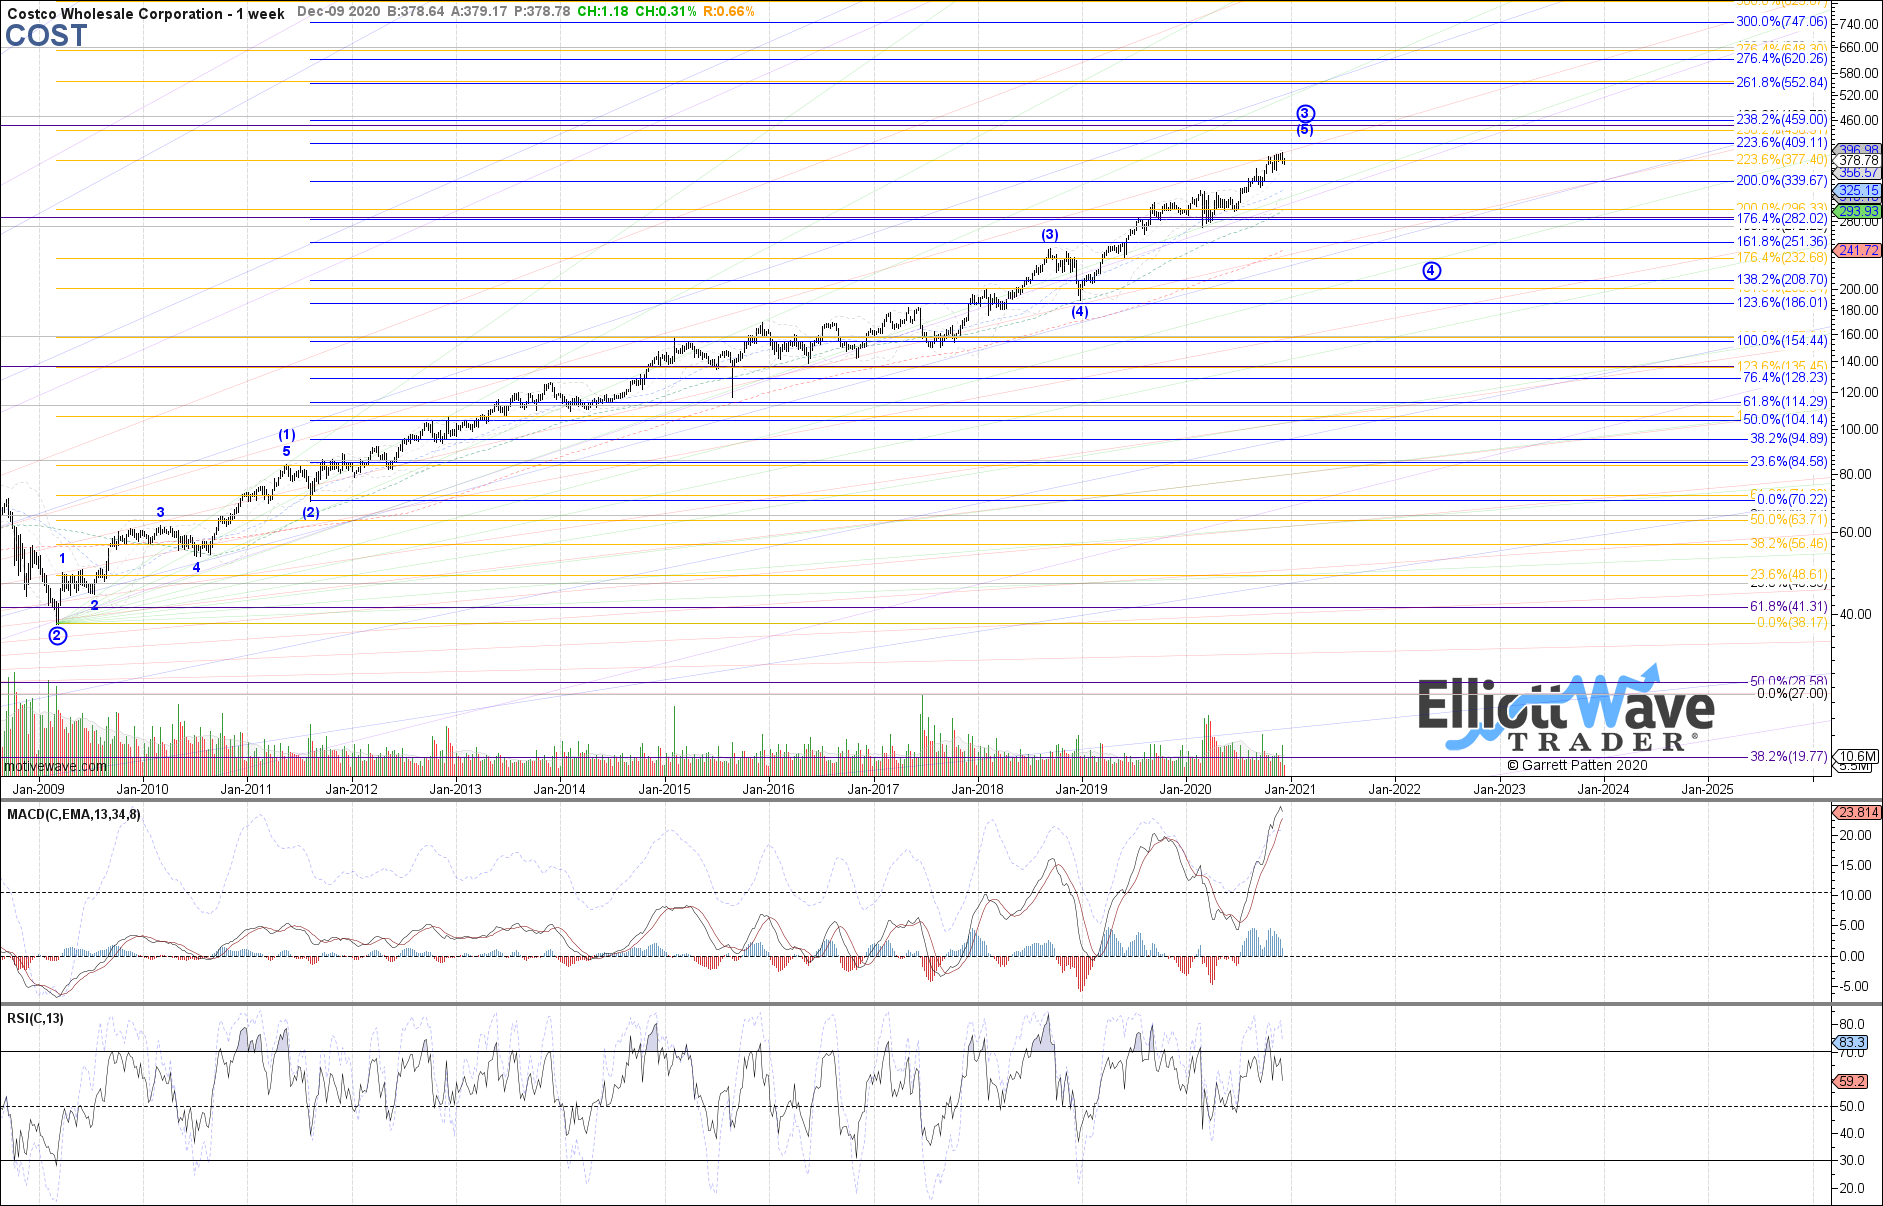
That’s a case where both technicals and fundamentals are suggesting that an otherwise good stock is currently in overbought territory, especially with interest rates no longer declining like they were earlier this year. Near-zero interest rates are the main justification for stocks like Costco being so highly-priced.
That’s not to say that a Costco correction or consolidation is a certainty, but given my range of options, Costco is not exactly a stock I want to pour new capital into at this time. It has admittedly done better than I expected since last time I looked at it, but these things have a habit of going further than expected and then turning when least expected. Valuations don’t matter over the course of any given year, but over a multi-year timeframe, valuations do play a large role for performance.
Johnson and Johnson
On the other hand, many health care stocks still look reasonably attractive compared to other alternatives, such as the broader S&P 500 (SPY) or Treasuries (IEF).
Johnson and Johnson (JNJ) for example is trading at an average valuation relative to its history, especially as we look out 1-2 years, assuming that consensus analyst expectations are mostly accurate:
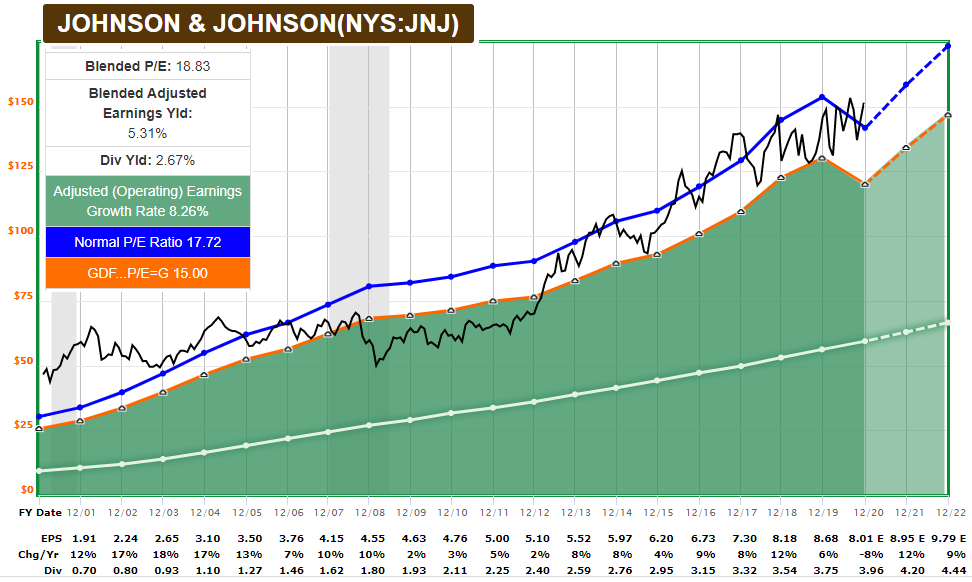
Chart Source: F.A.S.T. Graphs
Indeed, Garrett is tracking a technical bullish setup leading into next year:
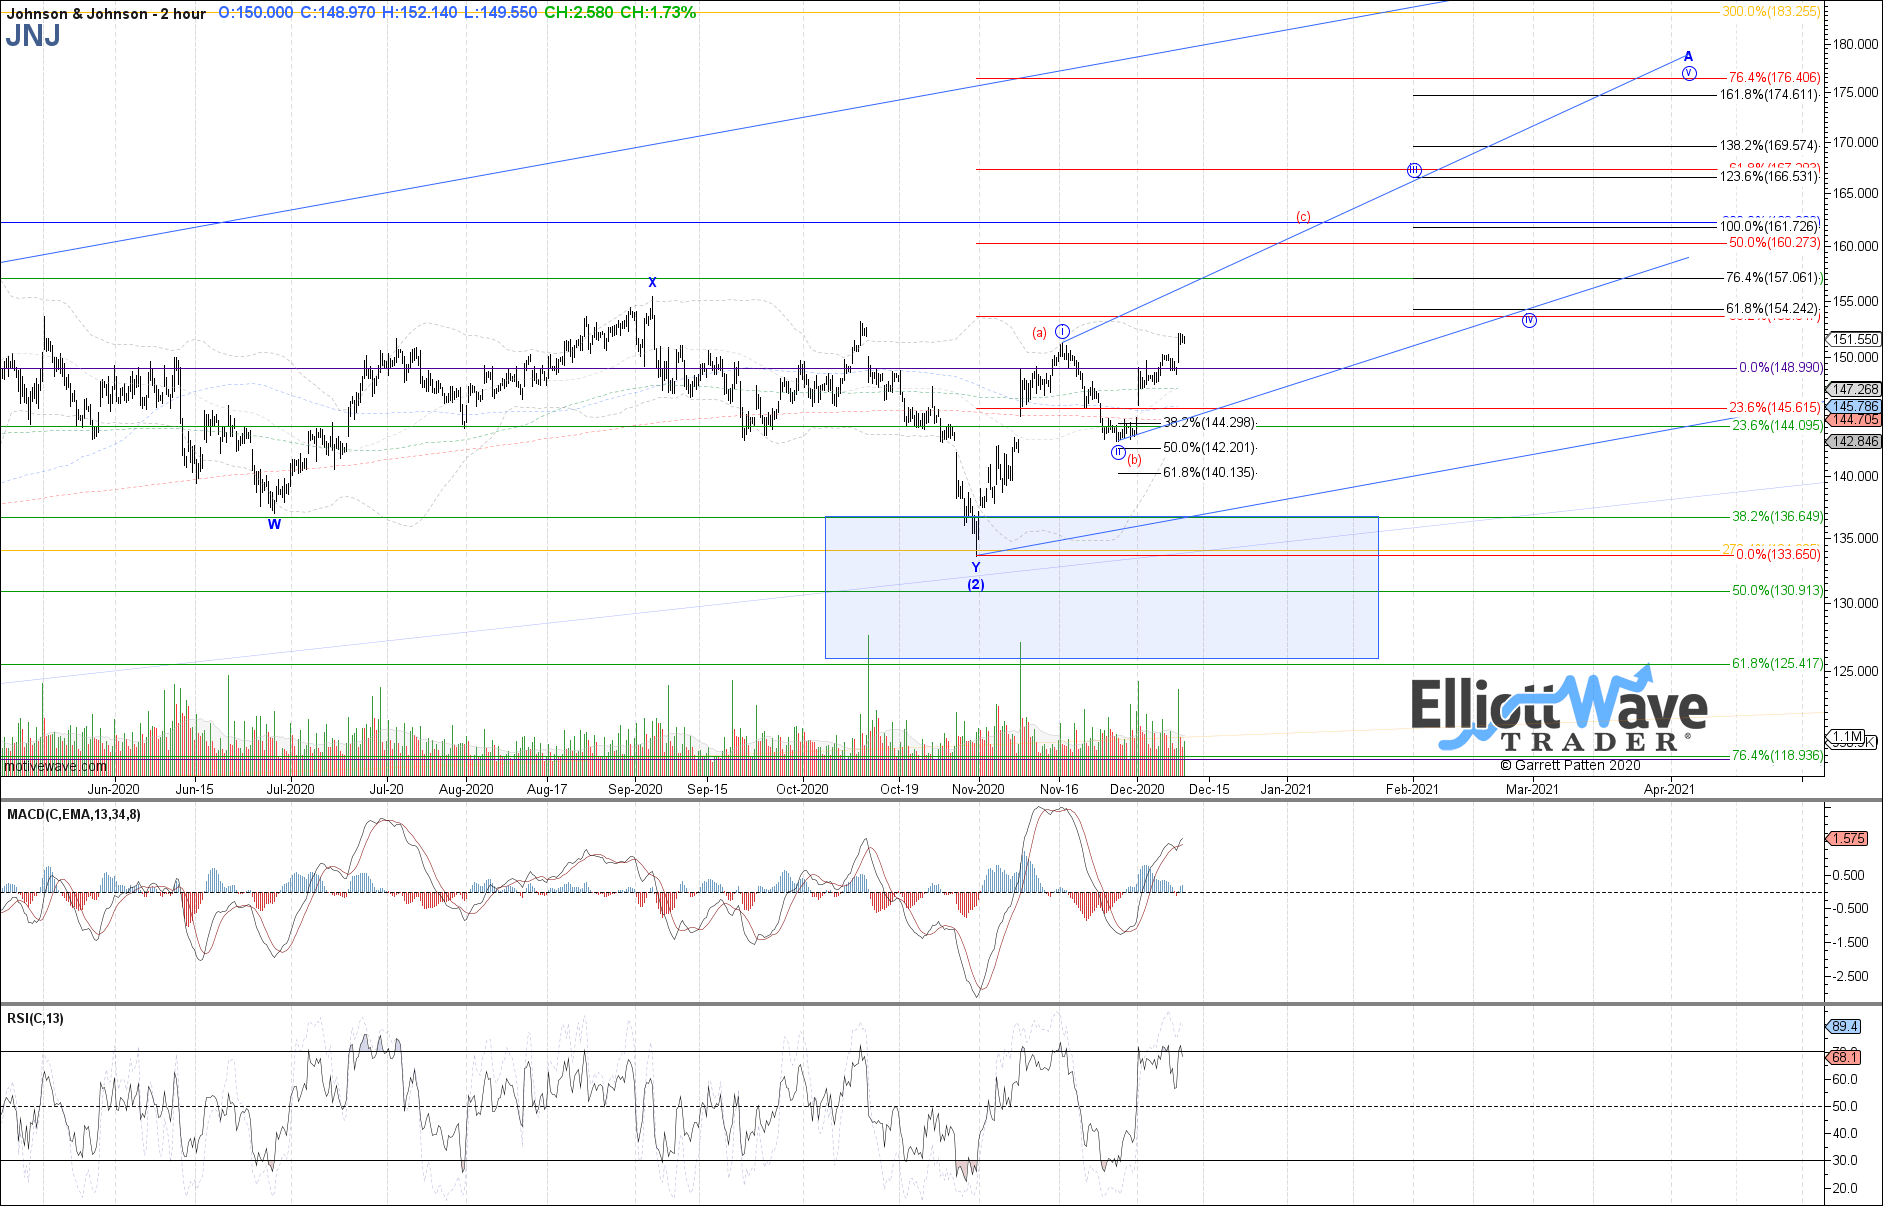
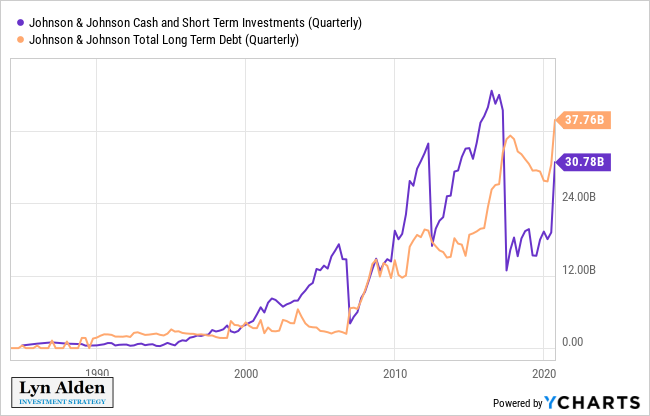
Johnson and Johnson is one of only two companies left that still have a perfect AAA credit rating. Taking into account their large amount of both debt and cash equivalents, their net debt position is very low, especially compared to their large and diversified income streams.
Energy Producers
I continue to view the energy sector favorably. It came up very far and very fast over the past five weeks and is vulnerable to near-term pullbacks, but I think there’s a strong runaway ahead.
My emphasis is on companies with low production costs and low decline rates, such as Lukoil (LUKOY), rather than US shale companies. However, even among US shale, Zac is seeing technical potential for more gains ahead after a near-term pullback:
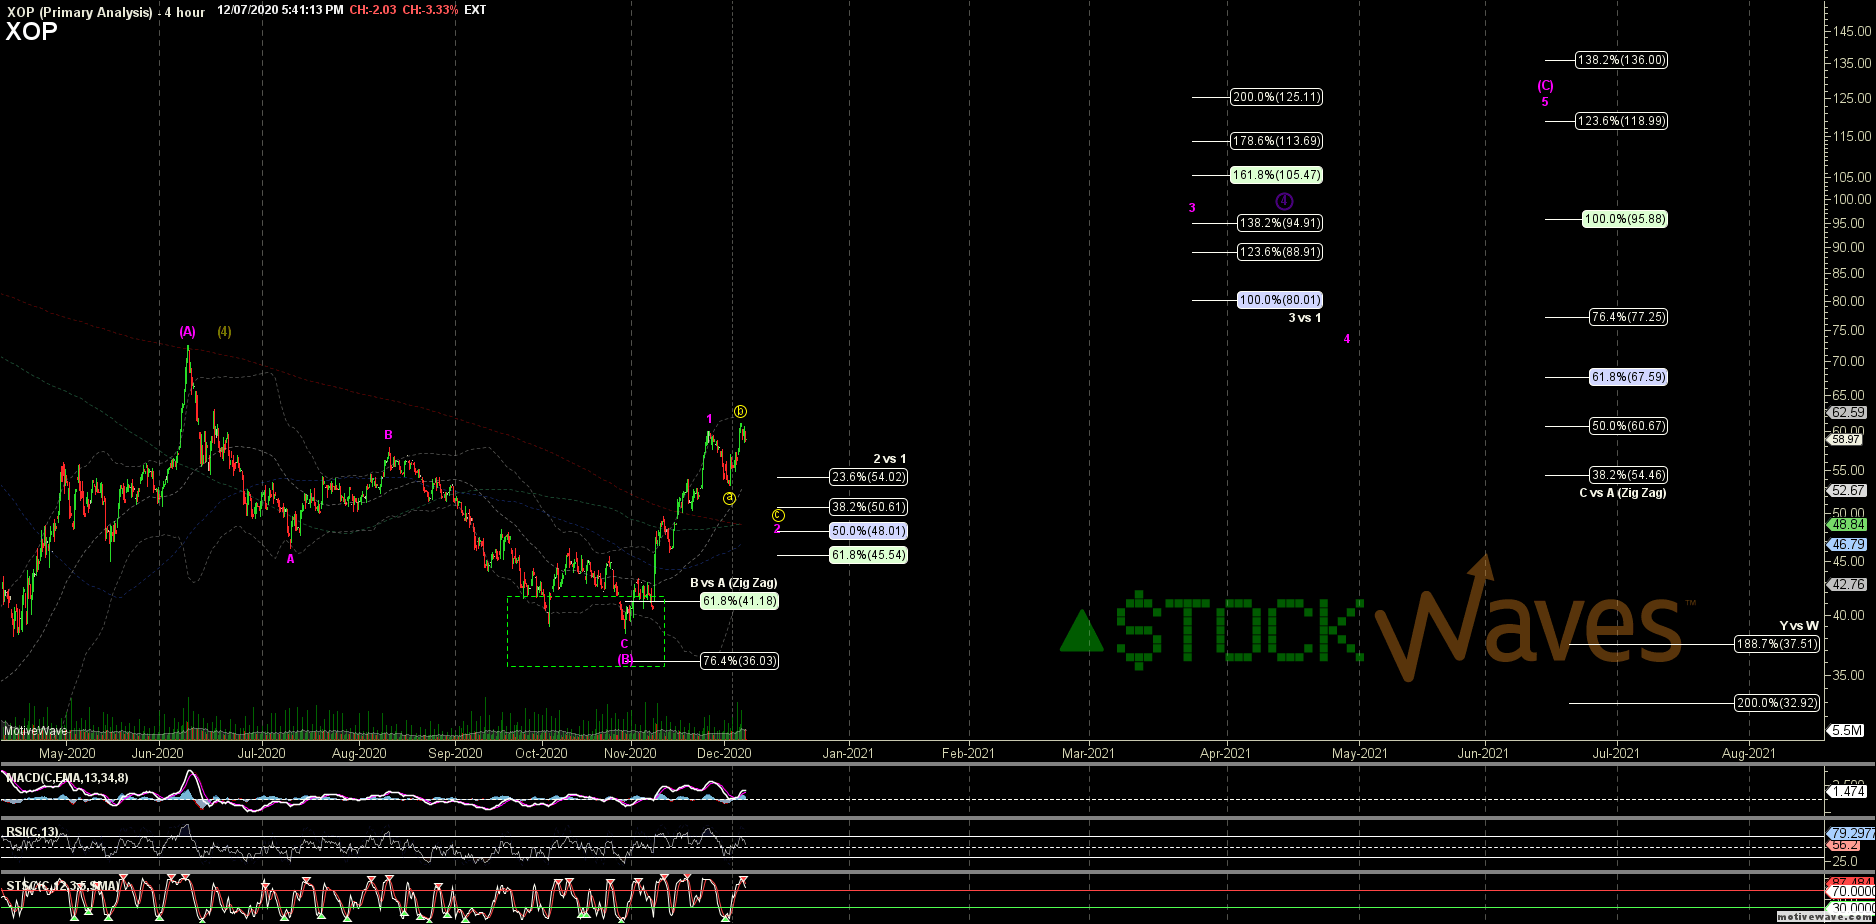
The crazy thing to realize is that if the SPDR S&P Oil and Gas Exploration and Production ETF (XOP) were to ever double its price from here as Zac's chart suggest that it might, that would just bring it back to where it was in early 2019. I don’t know if or when that will happen, but I do like select energy producers around the world.
This, in my view, is the key chart to be familiar with as it pertains to oil:
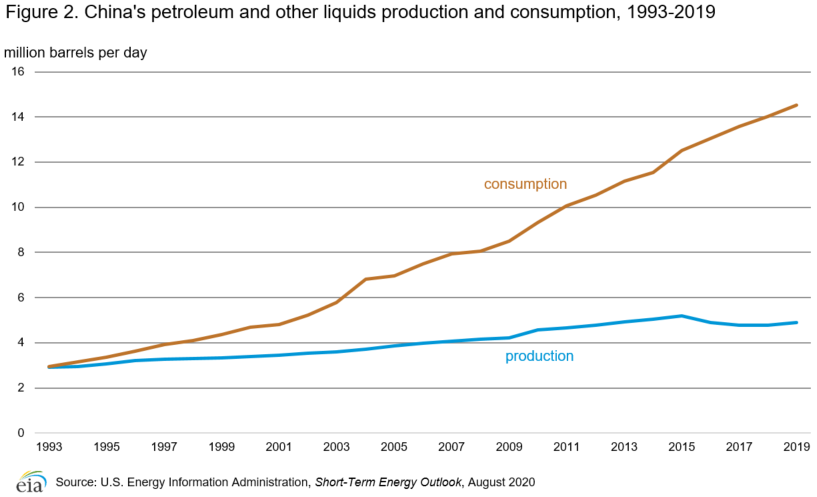
Chart Source: US Energy Information Administration
That gap represents China’s demand for energy imports. And India has basically the same chart as well, but with numbers that aren't quite as big yet.
Although 2020 temporarily crushed energy demand worldwide, the structural forces for Asian energy consumption continue to grow. In fact, China and India are still growing their absolute coal usage, let alone oil and gas and renewables.
And yet, because of this year’s bombed-out energy prices and demand destruction, energy companies all across the world cut capital expenditures, and supply went down. This is good, because the world was in a state of oversupply for the past several years, largely due to the ramp-up in unprofitable US shale production from investors willing to burn their capital and keep financing their losses for a decade straight.
However, with the rise of ESG investing and investors’ lower patience for capital-destroying shale oil, there’s a decent potential for a tighter supply/demand situation in the years ahead.
Uranium
Speaking of energy, uranium also looks good for those with a long-term view. The western world isn’t really building nuclear reactors, and indeed is gradually bringing some of them offline, but Asia is ramping up its nuclear fleet, led again by places like China and India who have insatiable energy demands and yet still consume far less energy per capita than the wealthier western world.
They’re keen on solar and wind energy wherever possible, but they have a huge percentage of their electricity generation still coming from coal, and their absolute coal usage continues to rise, contributing to poor air quality. New generation nuclear reactors are an energy source that they’ve increasingly been diversifying into for base power.
I covered uranium extensively in an October Stock Waves article for subscribers, and we’ve already seen a sharp bounce since then, but nonetheless, uranium stocks still look good as a small slice within a diversified portfolio for the long run.
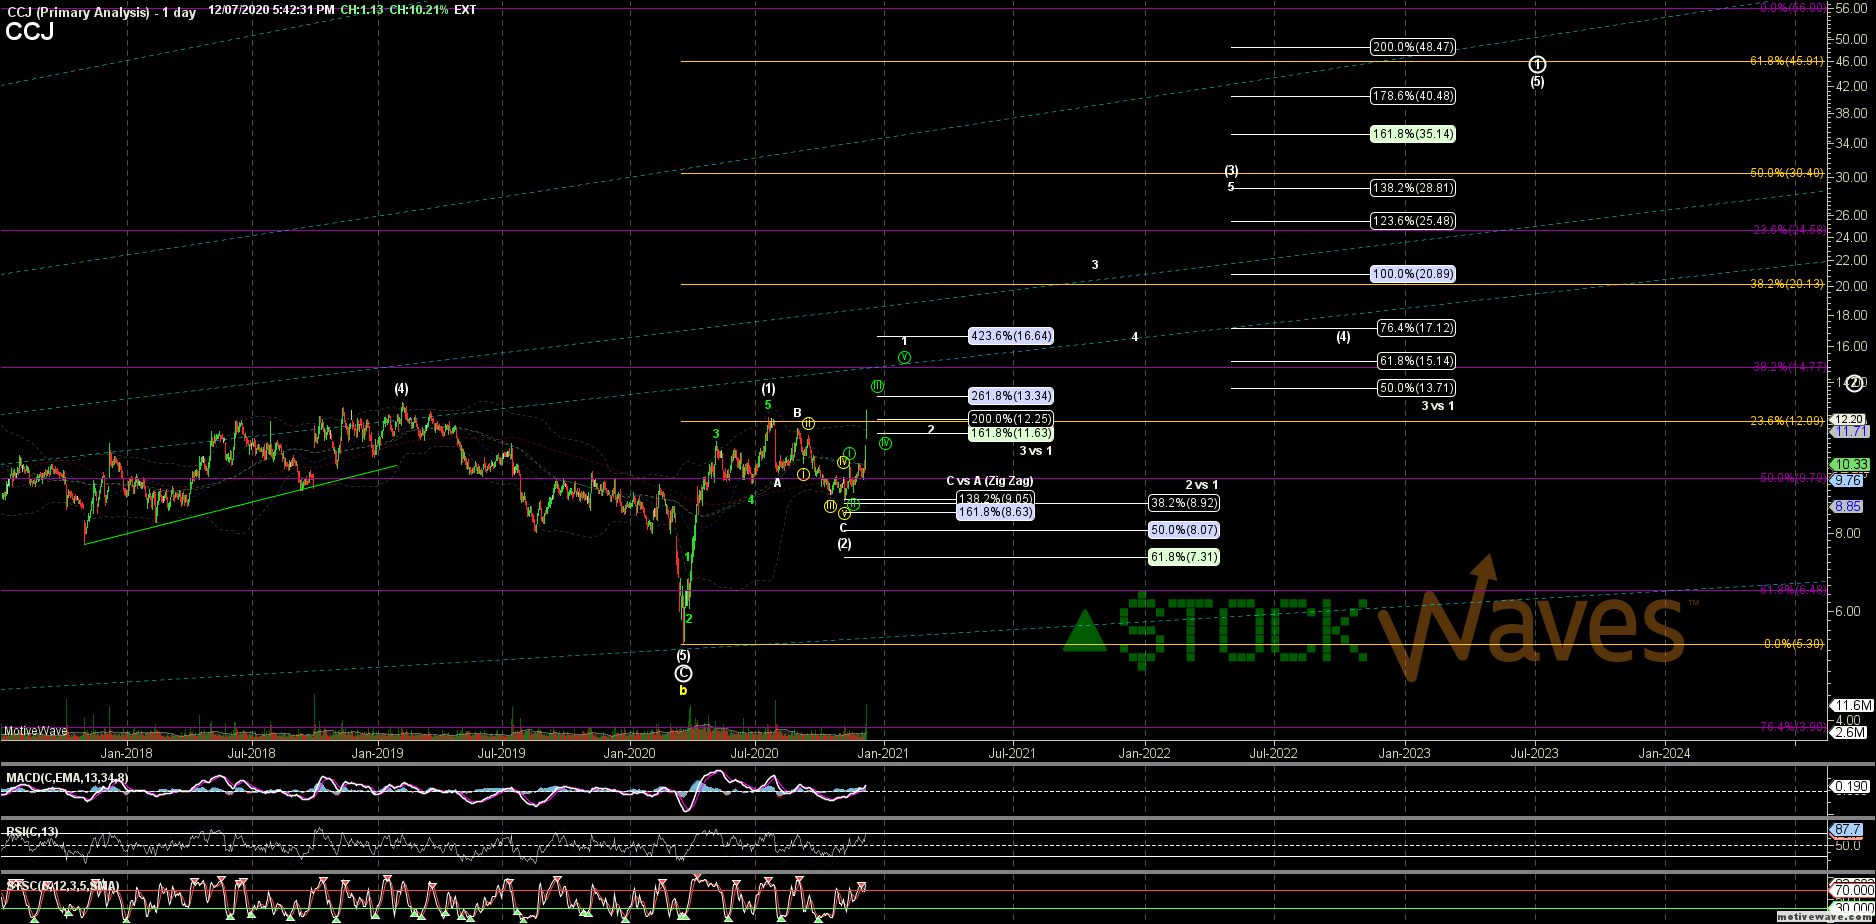
Here’s Zac’s long-term Cameco (CCJ) technical setup:
And here’s his shorter-term view:
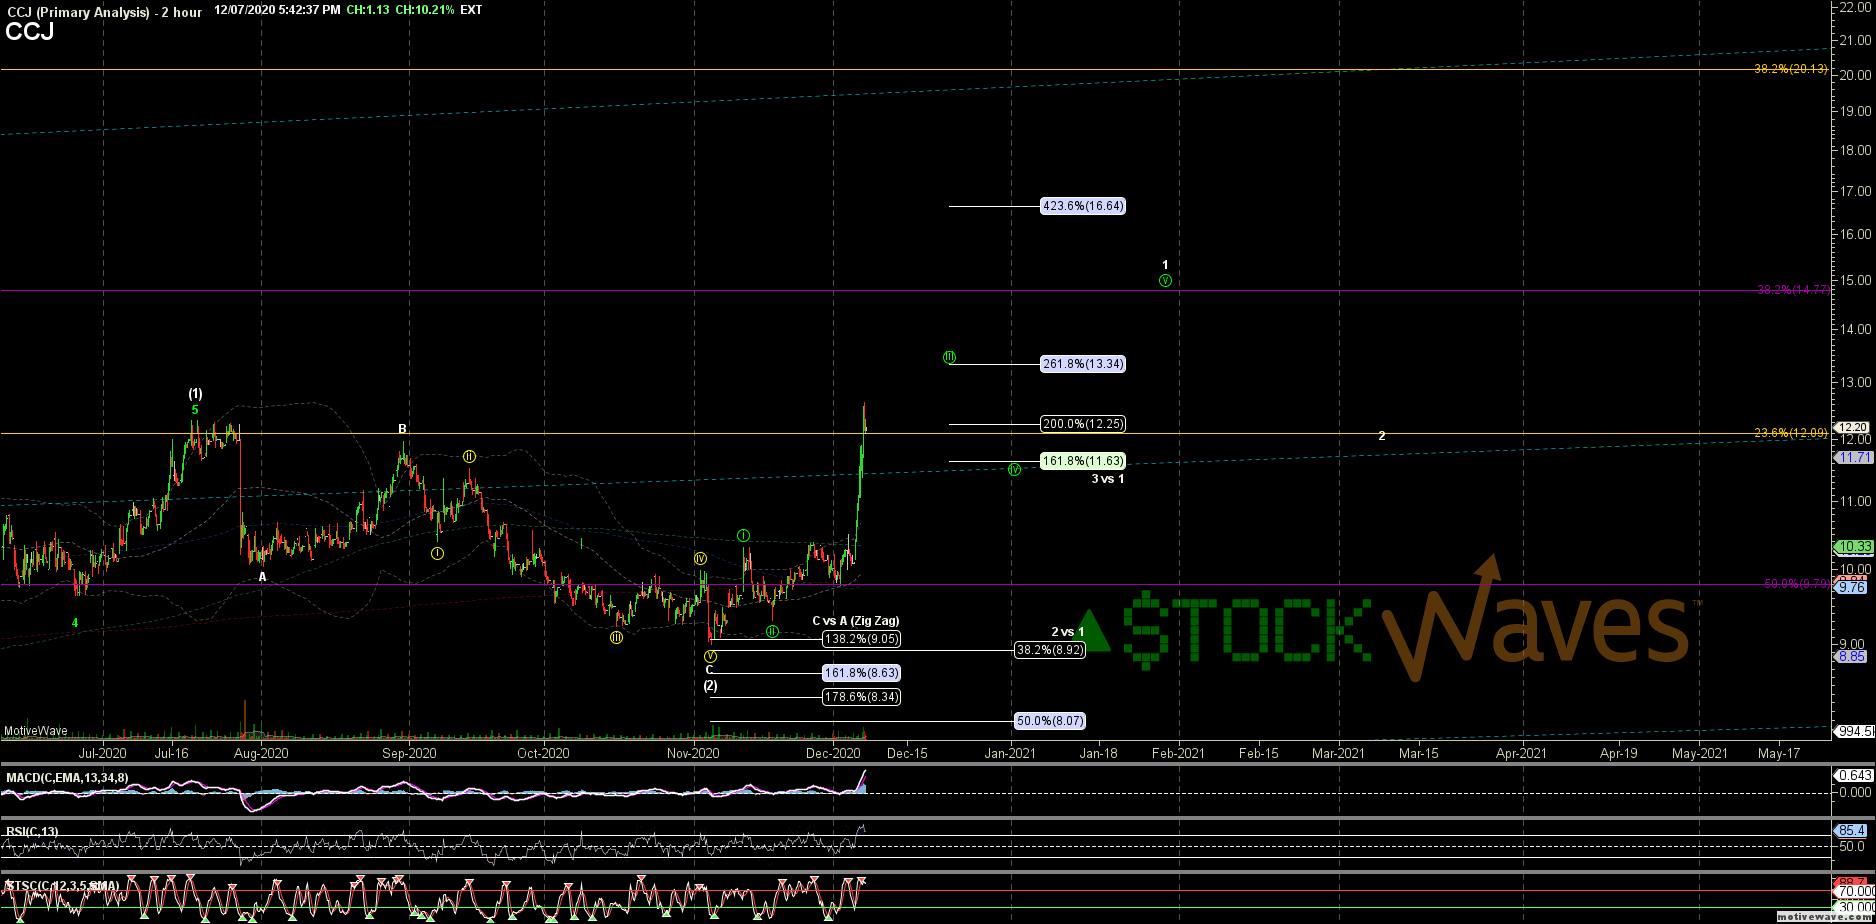
I don’t know what the price will do over any short-term timeframe, but the long-term bullish argument for uranium is as follows.
Ever since the 2011 Fukushima Daiichi nuclear disaster led to a number of nuclear facilities being brought offline, the uranium market has been very weak, with plenty of secondary supply. Over the years, reactors began gradually coming back online, and emerging markets began a new wave of reactor construction, but it took quite a bit of time.
For years, the uranium price has been below new production costs, so miners have curtailed production and capital hasn’t gone into building much new production. As a result, annual demand for uranium consistently outpaces annual production supply. However, existing secondary supply (from long-ago periods of oversupply) have been used to fill that gap. In fact, some miners are even buying secondary supply off the market and re-selling it to utilities, since that’s cheaper than actually digging it up.
In the years ahead, though, that supply/demand gap looks increasingly wide even when we disregard the upper case demand and just focus on the reference case demand:
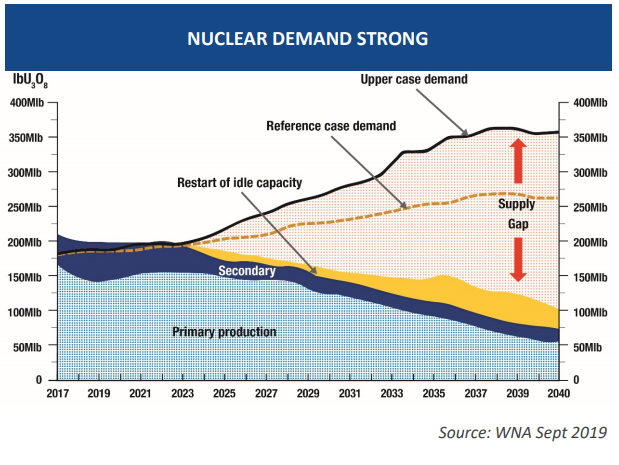
Chart Source: Deep Yellow November 2020 Presentation
This should eventually force higher prices in uranium, and cause more production to come online, but it’s a multi-year play.
Utilities normally buy long-term uranium supply contracts to ensure adequate coverage ratios. As we look deeper into the 2020’s, utilities are increasingly uncovered, and will need to come back into the market with more contract purchases:
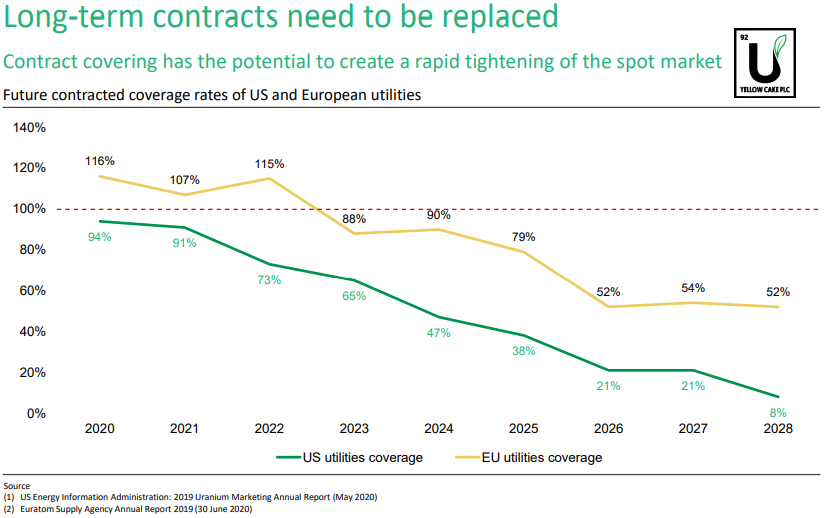
Chart Source: Yellow Cake PLC December 2020 Presentation
The price of uranium hit a cycle low in late 2016 after a 9-year bear market, and in the four years since then has been making higher highs and higher lows. Uranium is below production costs and rising over time, which tends to be among the more attractive situations for patient investors to buy into.
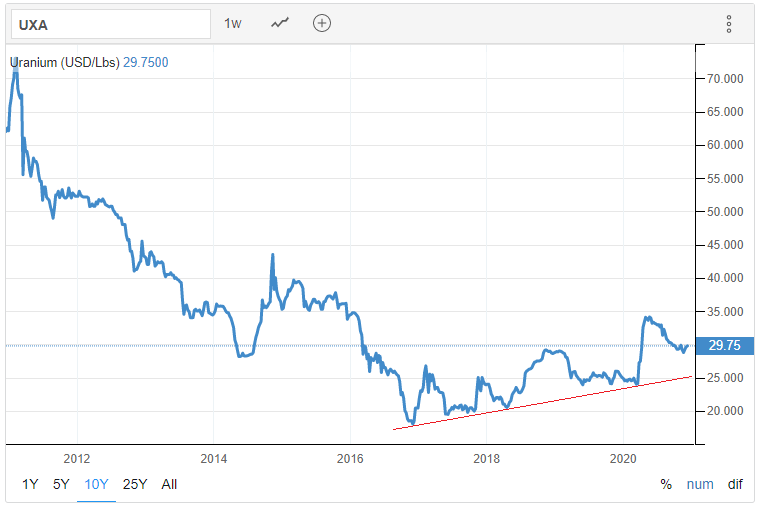
Chart Source: Trading Economics
I personally like the Uranium Participation Corp (URPTF) as a portfolio position with a long-term view, since it holds physical uranium.
