What's Next For Bitcoin?
 By
Ryan Wilday
By
Ryan Wilday
Bitcoin Intermediate to Long Term View
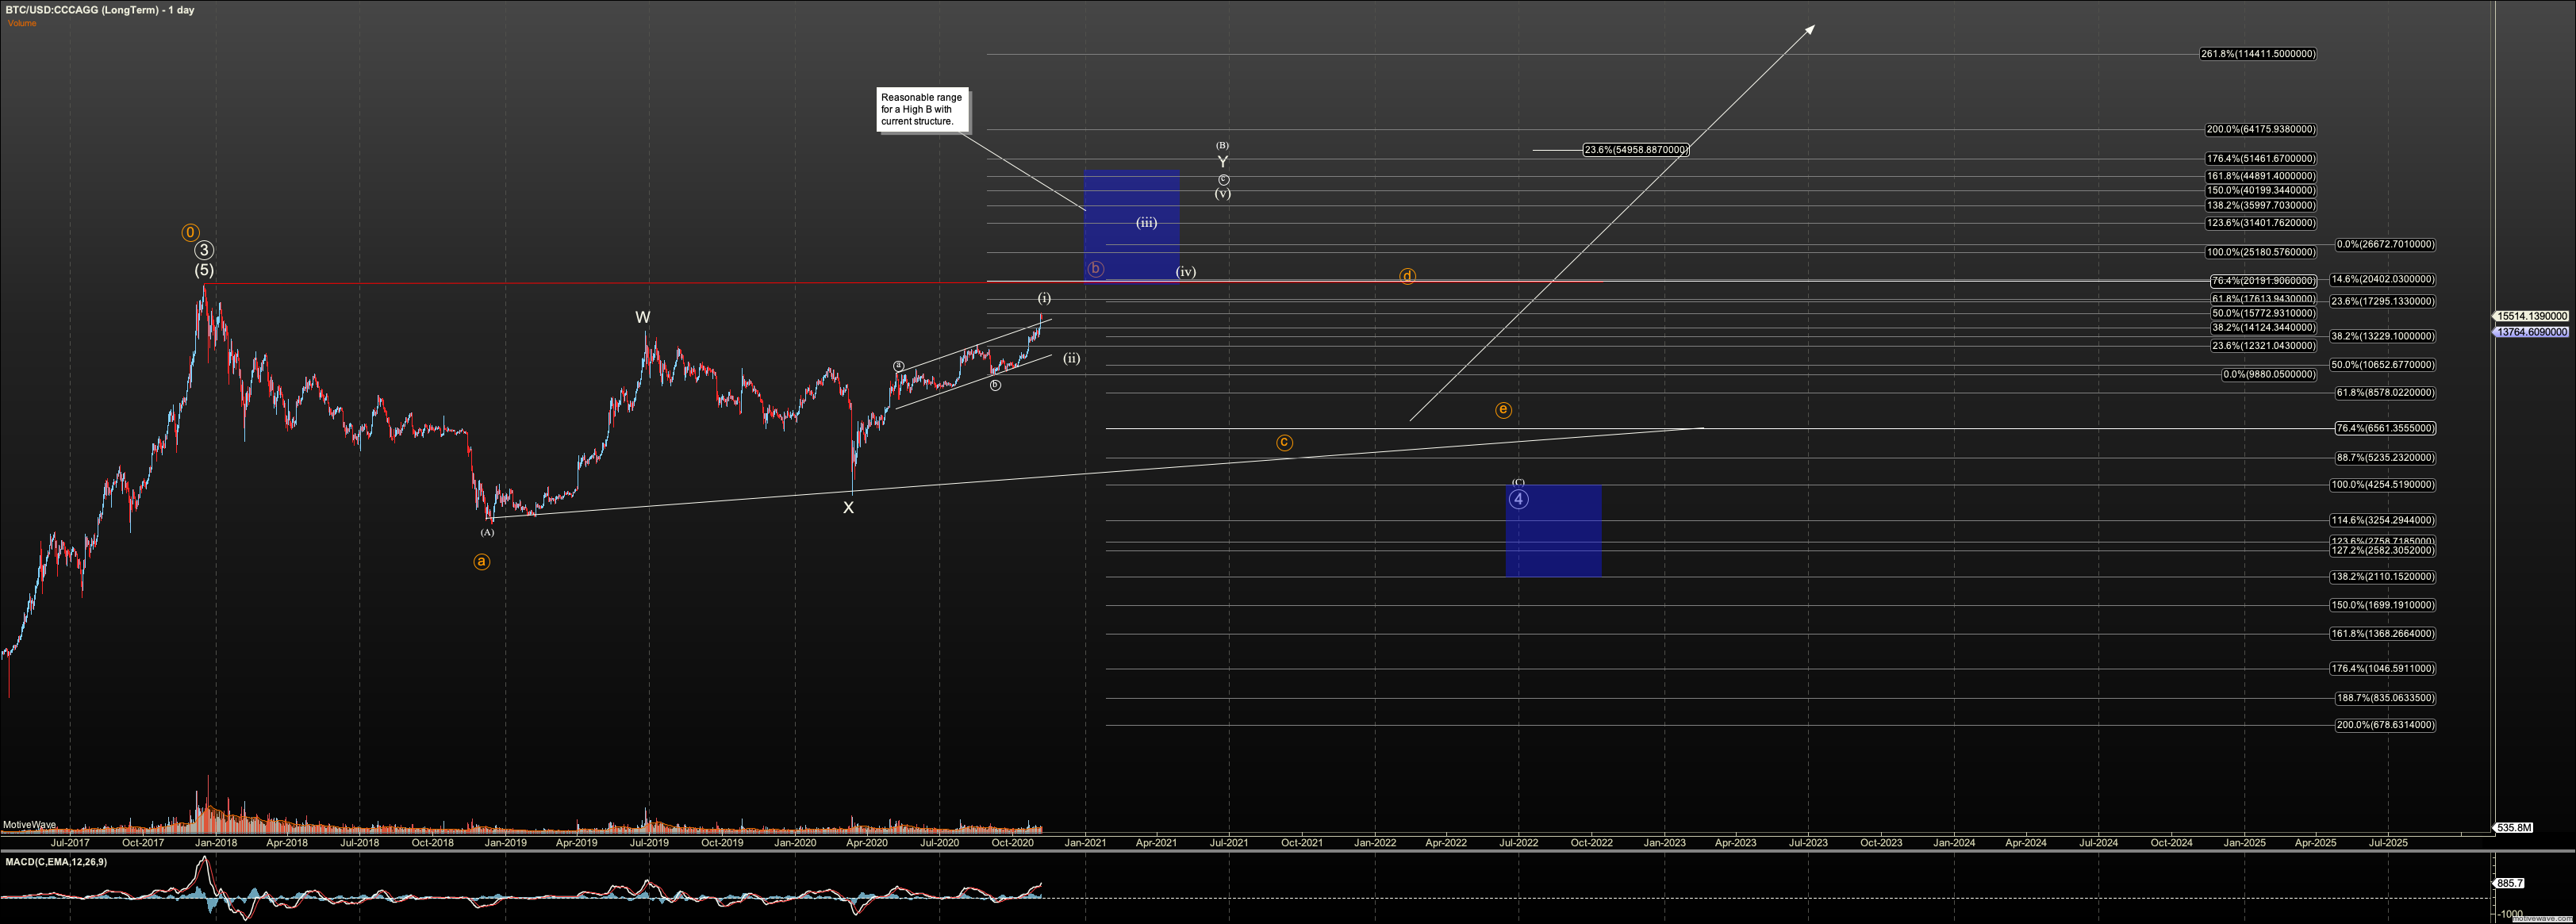
Since the March 2020 break down, my leaning has been that our large coins are unlikely to achieve escape from the bear market that started with the 2017 top in bitcoin in the next year or so. Note that when I say the bear market remains intact, I am speaking from an Elliott Wave analyst’s perspective. The discipline considers a high B wave that breaks the previous bull market's high a part of an unfolding correction and precedes a C wave which brings us back into the bear market range. B waves are very different in structure from impulsive breakouts. They are three waves, not five. The only means by which I see the bear market ending is if we are in a large ending diagonal. Structure does support a diagonal as they are motive waves with corrective internals. I continue to explore this scenario but have not found any satisfactory conclusions yet. A B-wave is what we have in the most orthodox perspective.
Provided I am correct that the 2020 rally is part of a B wave, we can look to two potentials: A flat, or a triangle. The perspective that we are in a triangle is rendered in orange on the long term chart, but is considered invalid over the bull market high at $19,500. Note I’m using a rounded number as the actually high varied widely on exchanges due to a loss of liquidity at the top.
The more typical perspective suggests we are in a large flat. That flat can be standard where the B doesn’t breach the previous bull market high. A running or expanded flat may show where the B wave does breach the previous bull market highs and is a very typical structure in cryptos. If the C wave drops below the A wave low @ $3125 after a B wave broke out it would be called expanded. If the C wave terminates higher than the A wave bottomed, we’d call the flat running. Running flats suggest the following 5th wave, in this case expected to hit at least $250K, may extend.
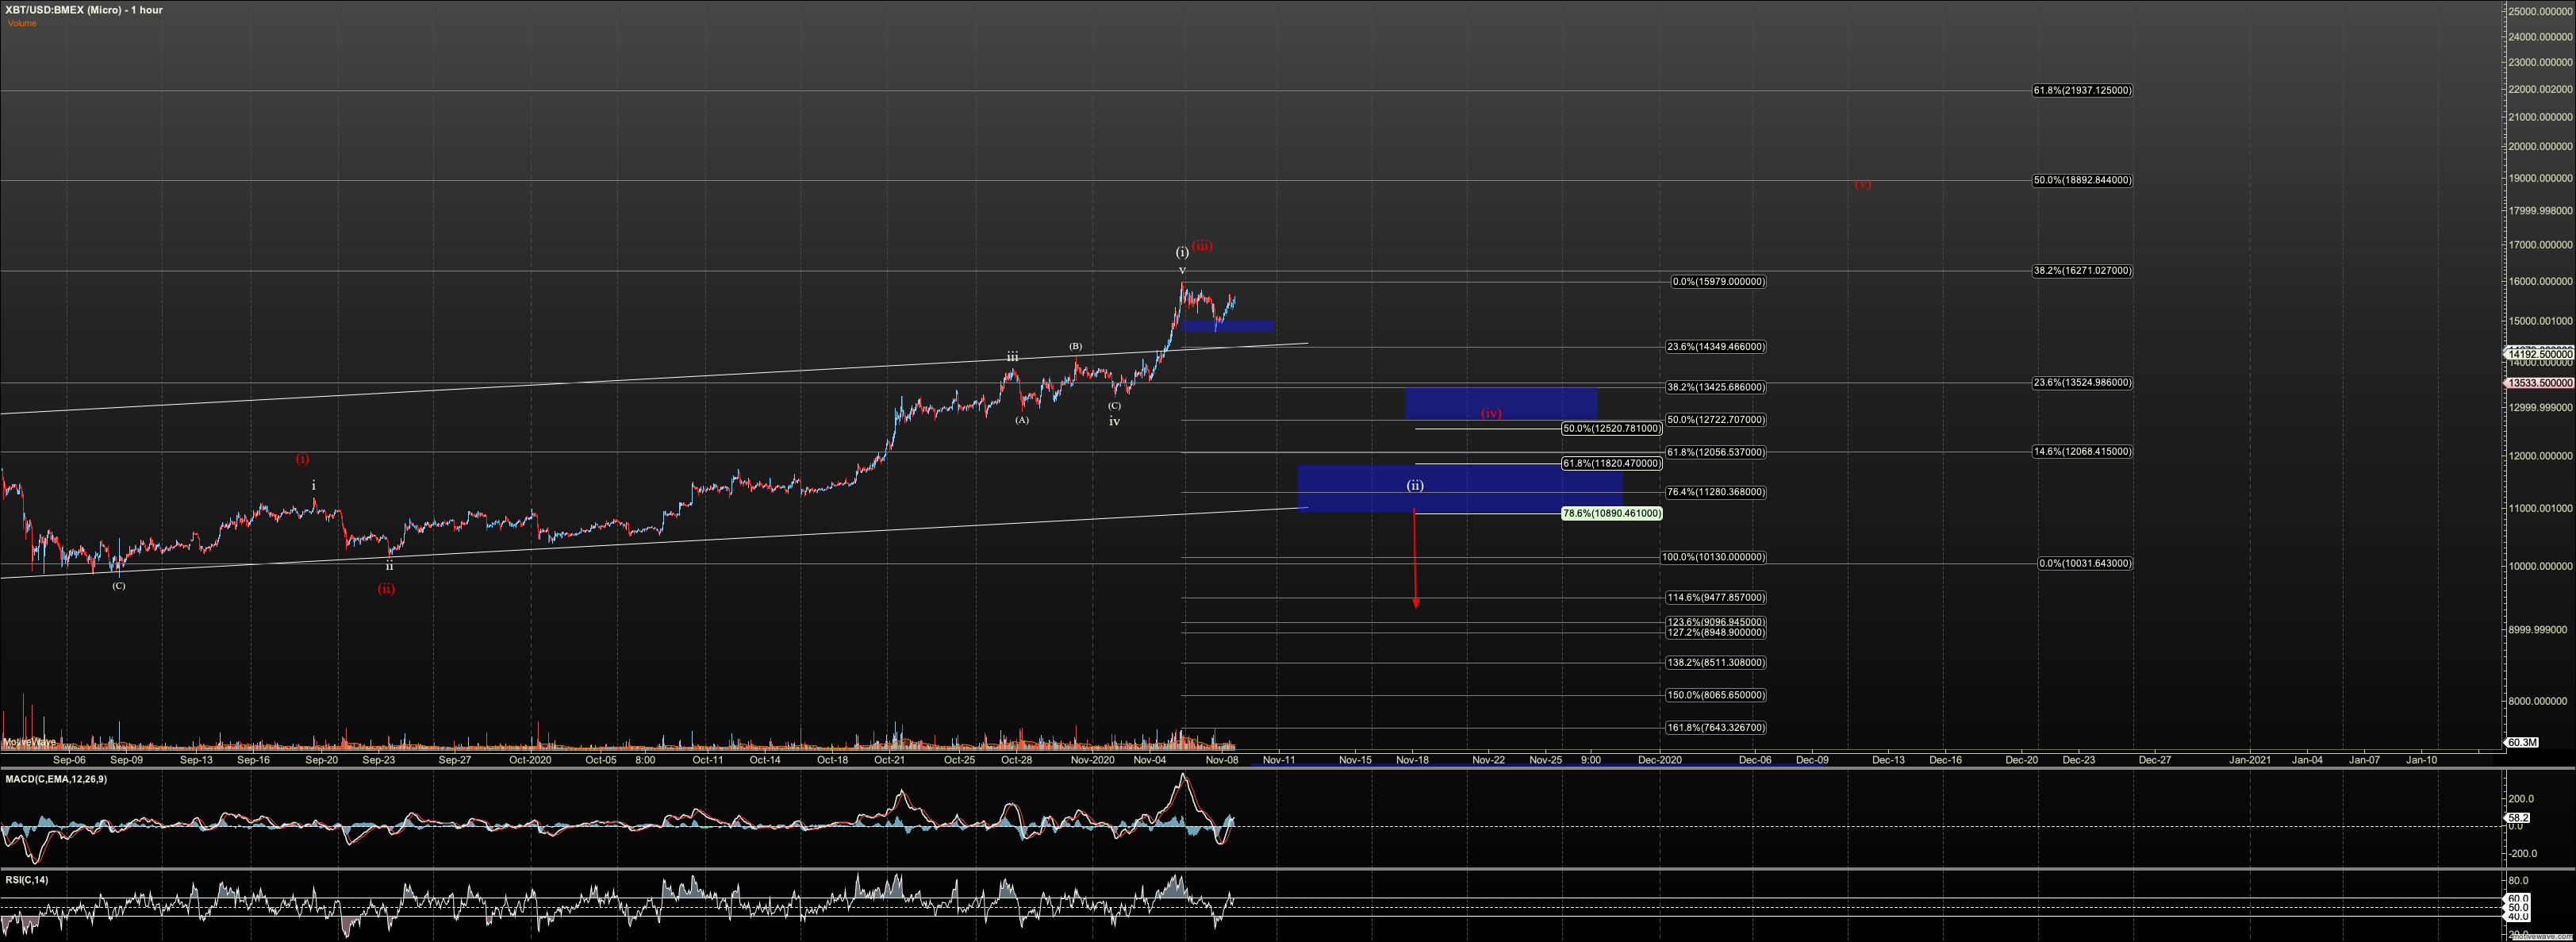
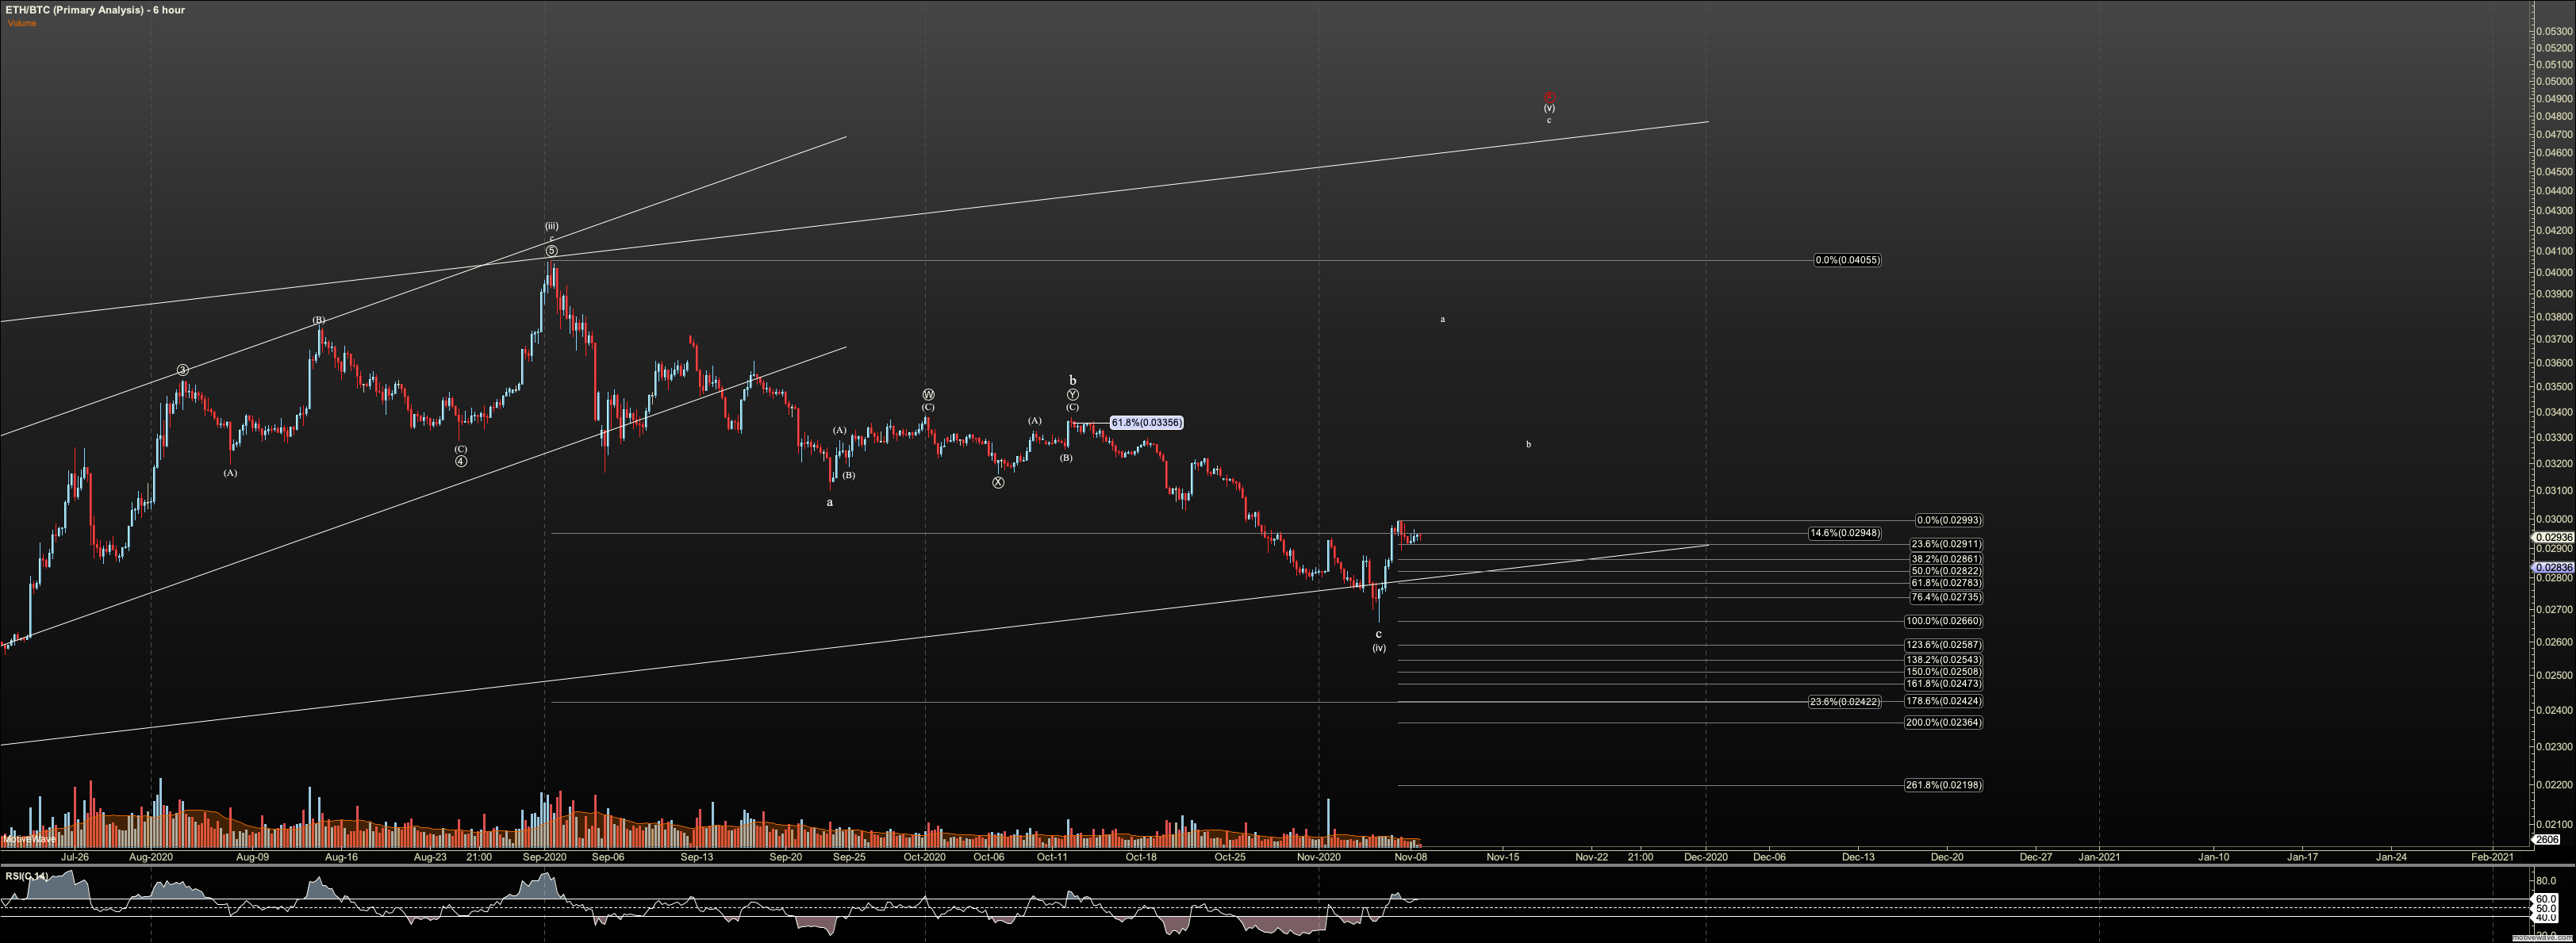
As we zoom in a bit, we can make the argument that our (b) wave should push to at least $34K based on what I consider a ‘running flat’ for circle-b of the Y wave. I now have a projected the termination of our (b) as circle-c of Y. However, we are not at a key point to test that theory with the completion of the first impulsive structure (i) to show in all of 2020. Five waves completed from the low at $9800 to now. If we can now hold a wave 2, that impulsive is a wave 1 and we can see the market push to $34K, even to $56K. If that wave 2 does not hold, we should consider the 2020 rally complete barring unforeseen. As of writing support for (ii) is $10,890.
Ethereum Intermediate to Long Term View
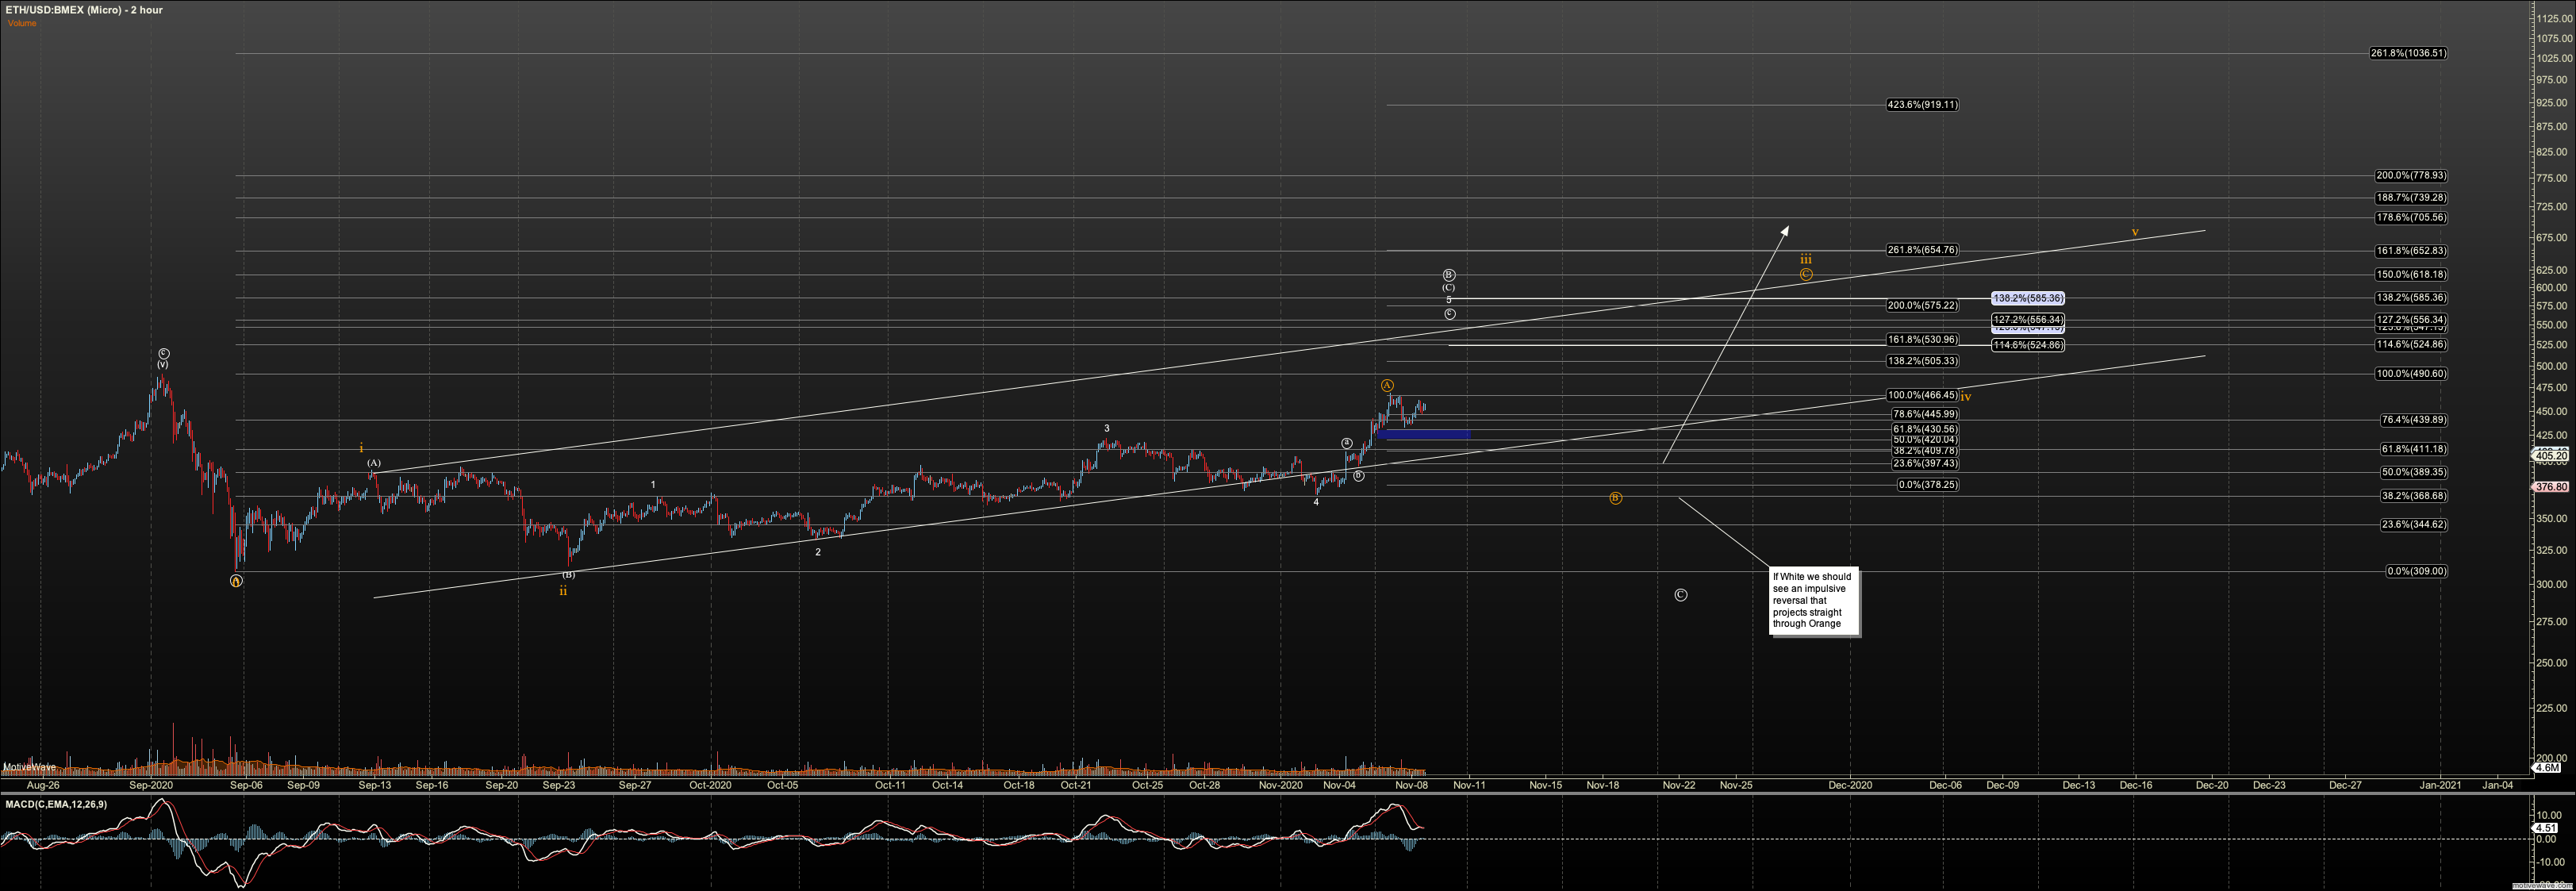
Between Bitcoin, and Ether, Ether gave the more pronounced warning after the March 2020 breakdown.
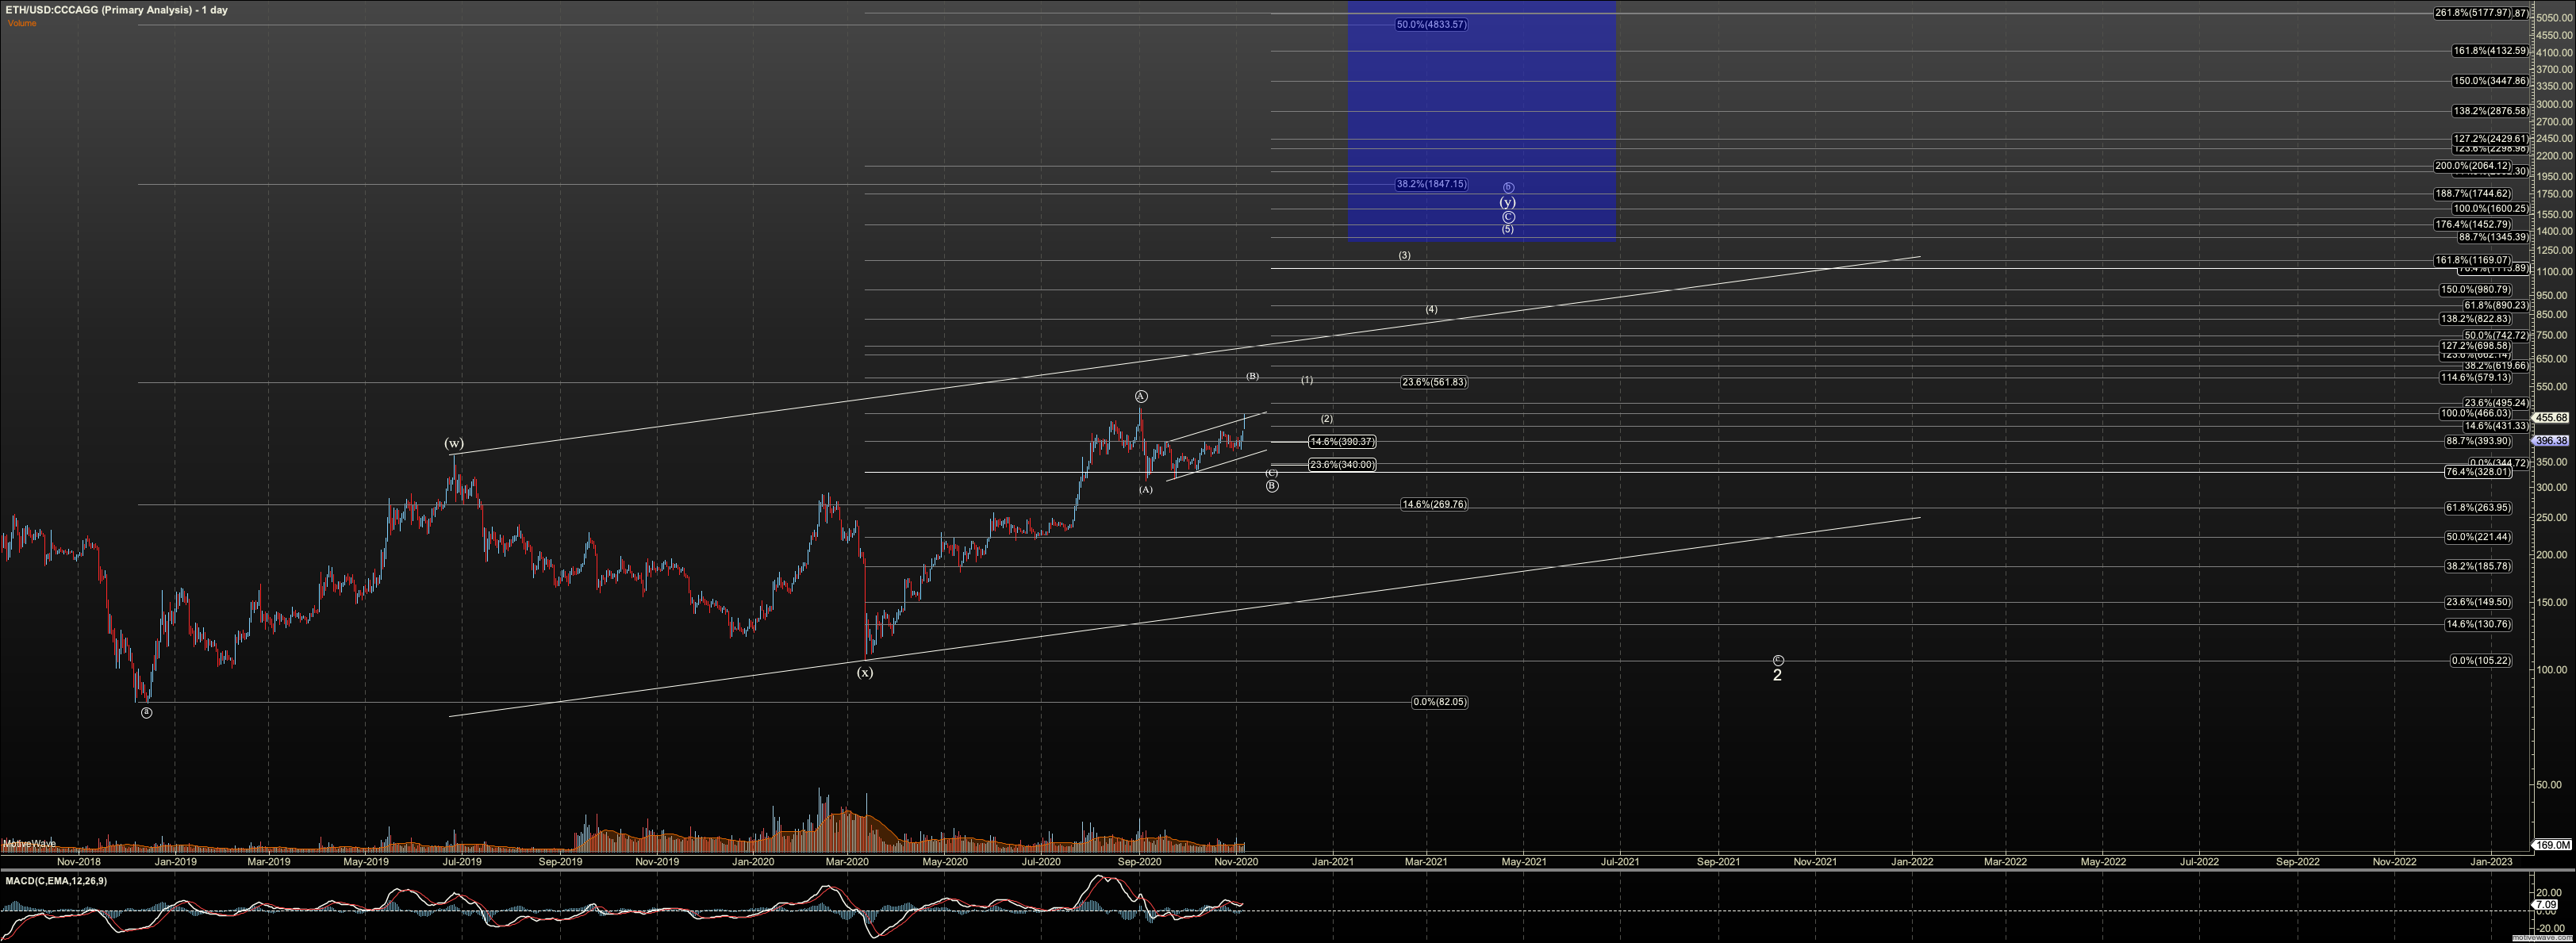
Note in this iteration of the intermediate term view, I am making the assumption that Ethereum will be drawn into the 2020 breakout in BTC. This conclusion is not a given as long as the September high holds, however, price currently is pressing the high and breaking it seems reasonable. If price breaks I will watch for a the market to complete C of the Y wave in very similar structure to Bitcoin, and that high can reach to at least $1400. However, note that the current price structure does not offer what I need for a more refined projection.
Once we are have achieved a completed Y of circle-b on the long term chart, I can project the circle-c. Depending on the height of circle-b, circle-c may or may not project below the December 2018 low. And, once complete circle-c is complete we should see a major bull market begin.
Note if my presumption that Ether breaks over the September high fails, we have a projection to as low as $26 in circle-c. This means that this intermediate view could have a very short shelf-life.
GBTC Intermediate to Long term View
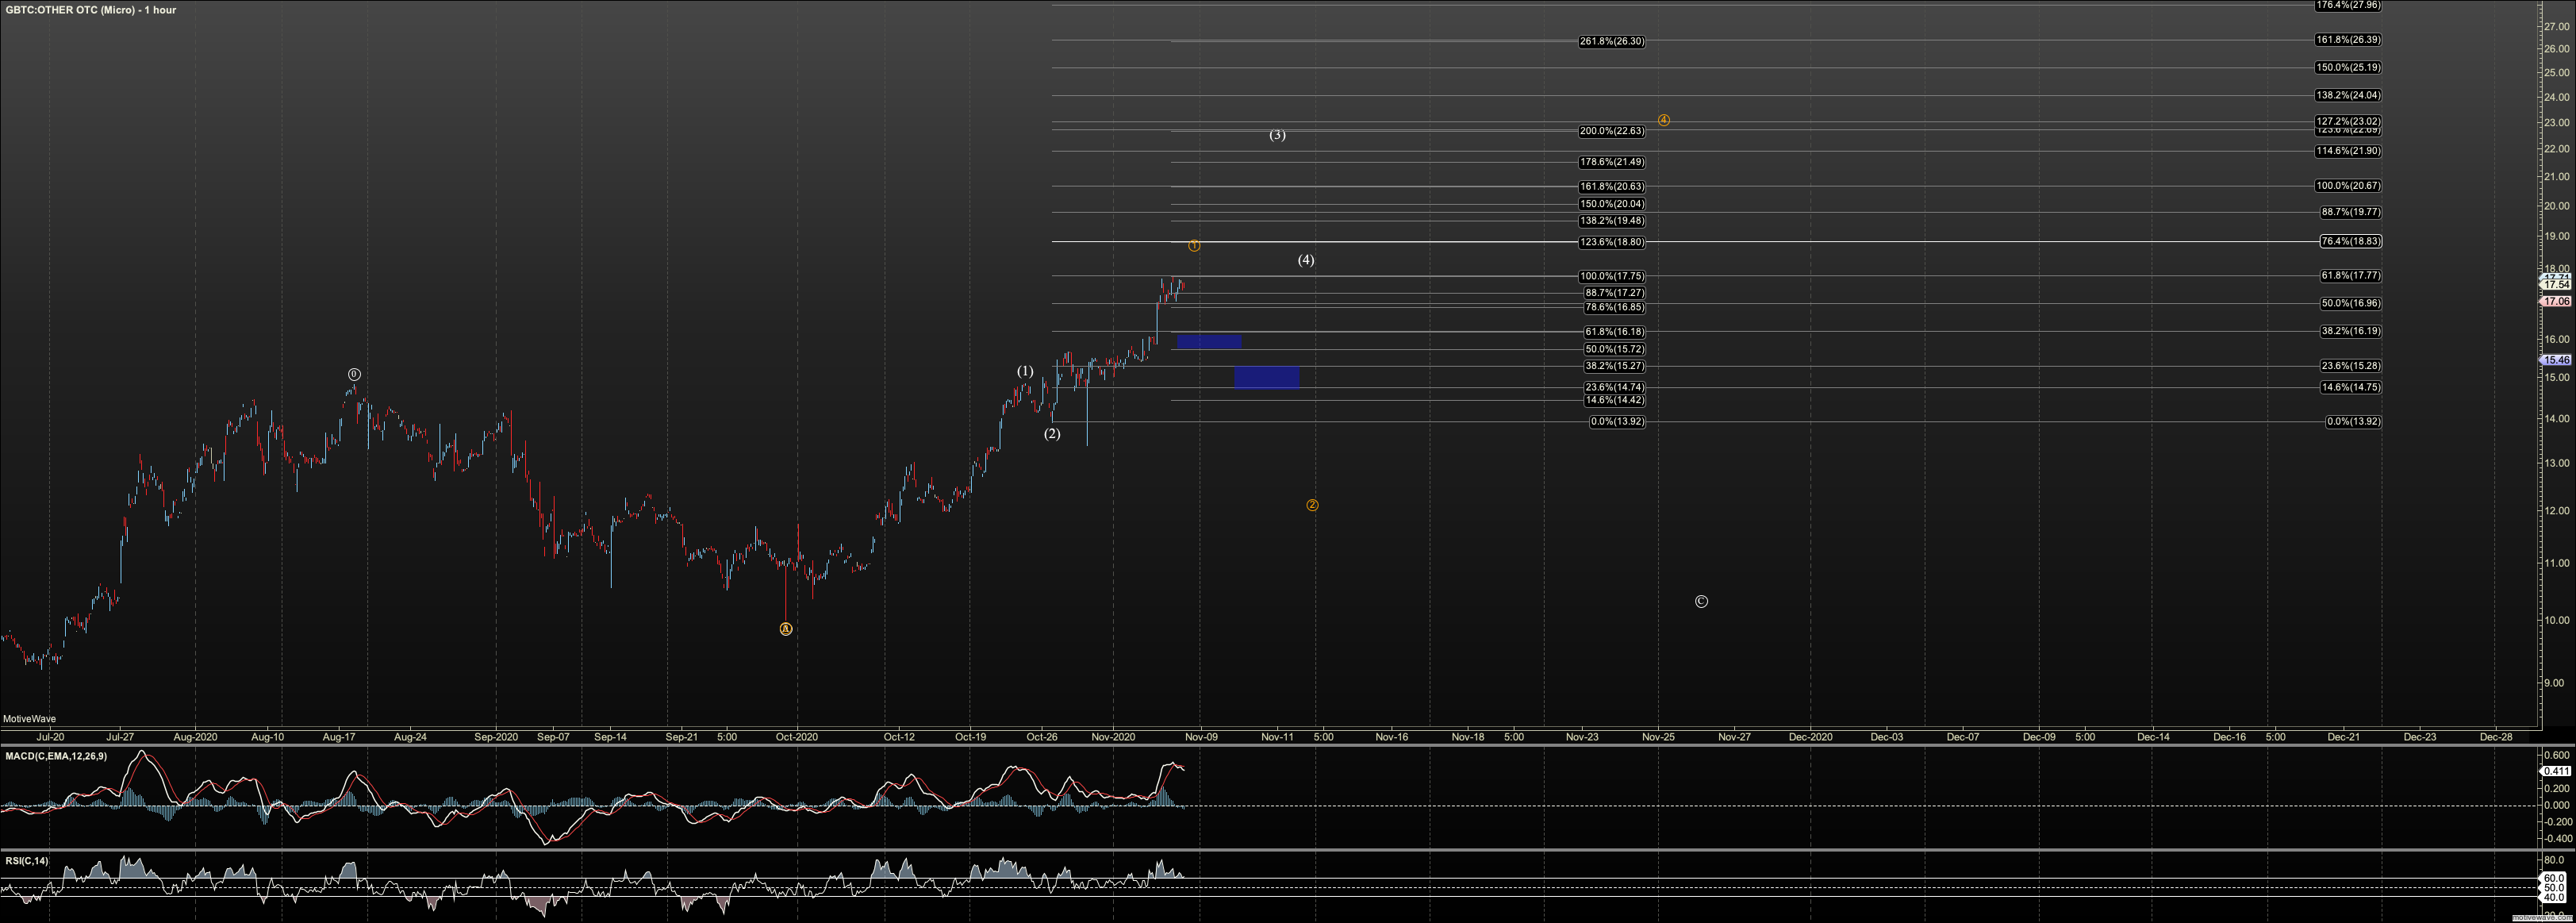
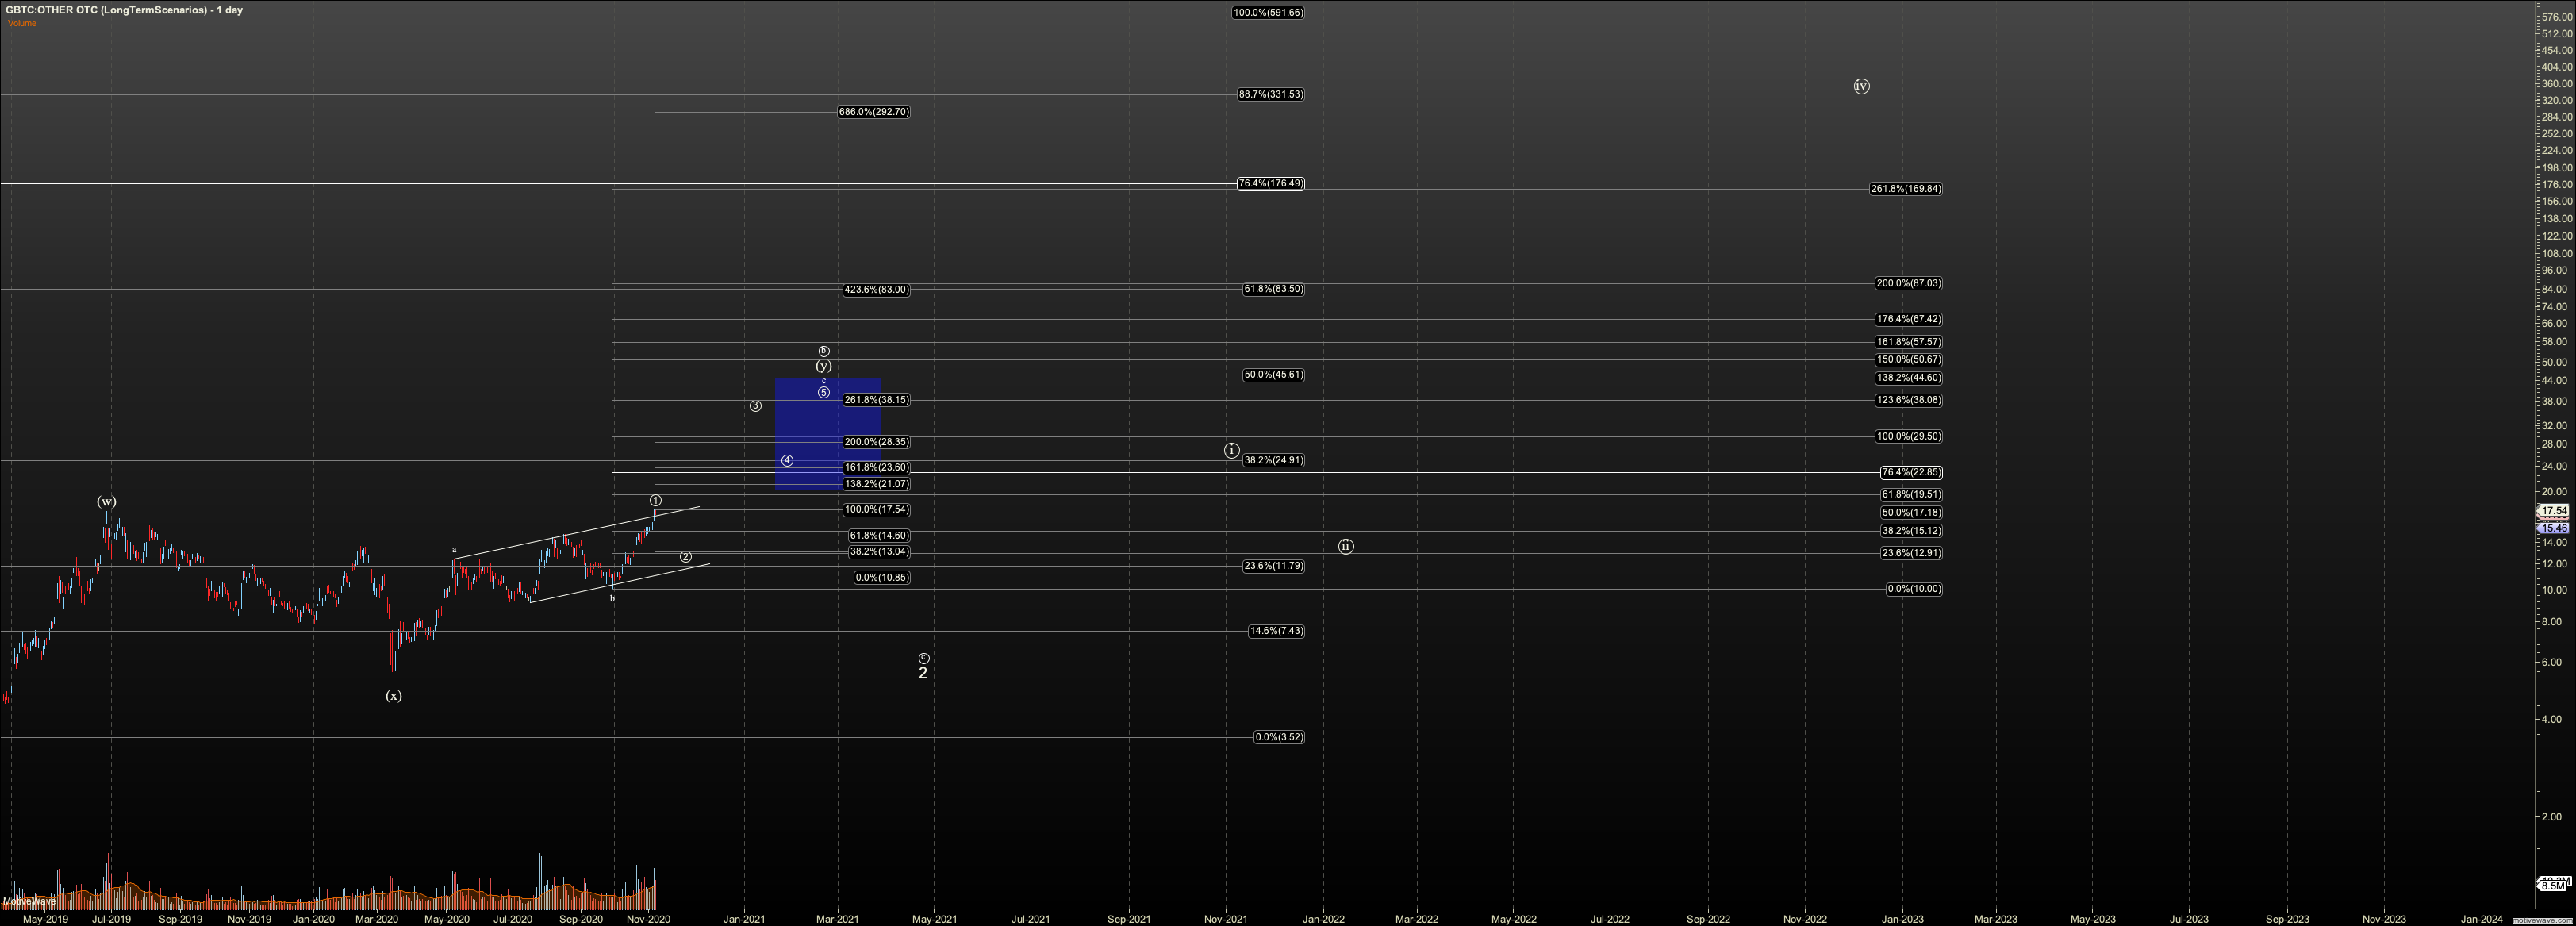
Since the last update GBTC has invalidated my triangle count, breaking to new 2019-2020 highs. However, the structures still supports a corrective B wave. With this breakout I see a Y wave projection to complete circle-b, similar to Bitcoin.
The micro count in GBTC is far less clear than Bitcoin, which is not uncommon. Note that I have rendered the GBTC count similar to Bitcoin with a top in circle-1 imminent. This is forcing GBTC into similar structure as Bitcoin, not demanded of it by its micro. I do not consider circle-1 topped until we breach $13.50. Until then it is entirely possible to see GBTC push higher in the Y wave.
The projection for circle-c of 2 will need to wait until circle-b completes. However, similar to Bitcoin, this C wave can be below the end of circle-a (sub $2) or stay above in a running flat.