US Dollar Moves Down After Hitting and Holding Key Resistance
 By
By
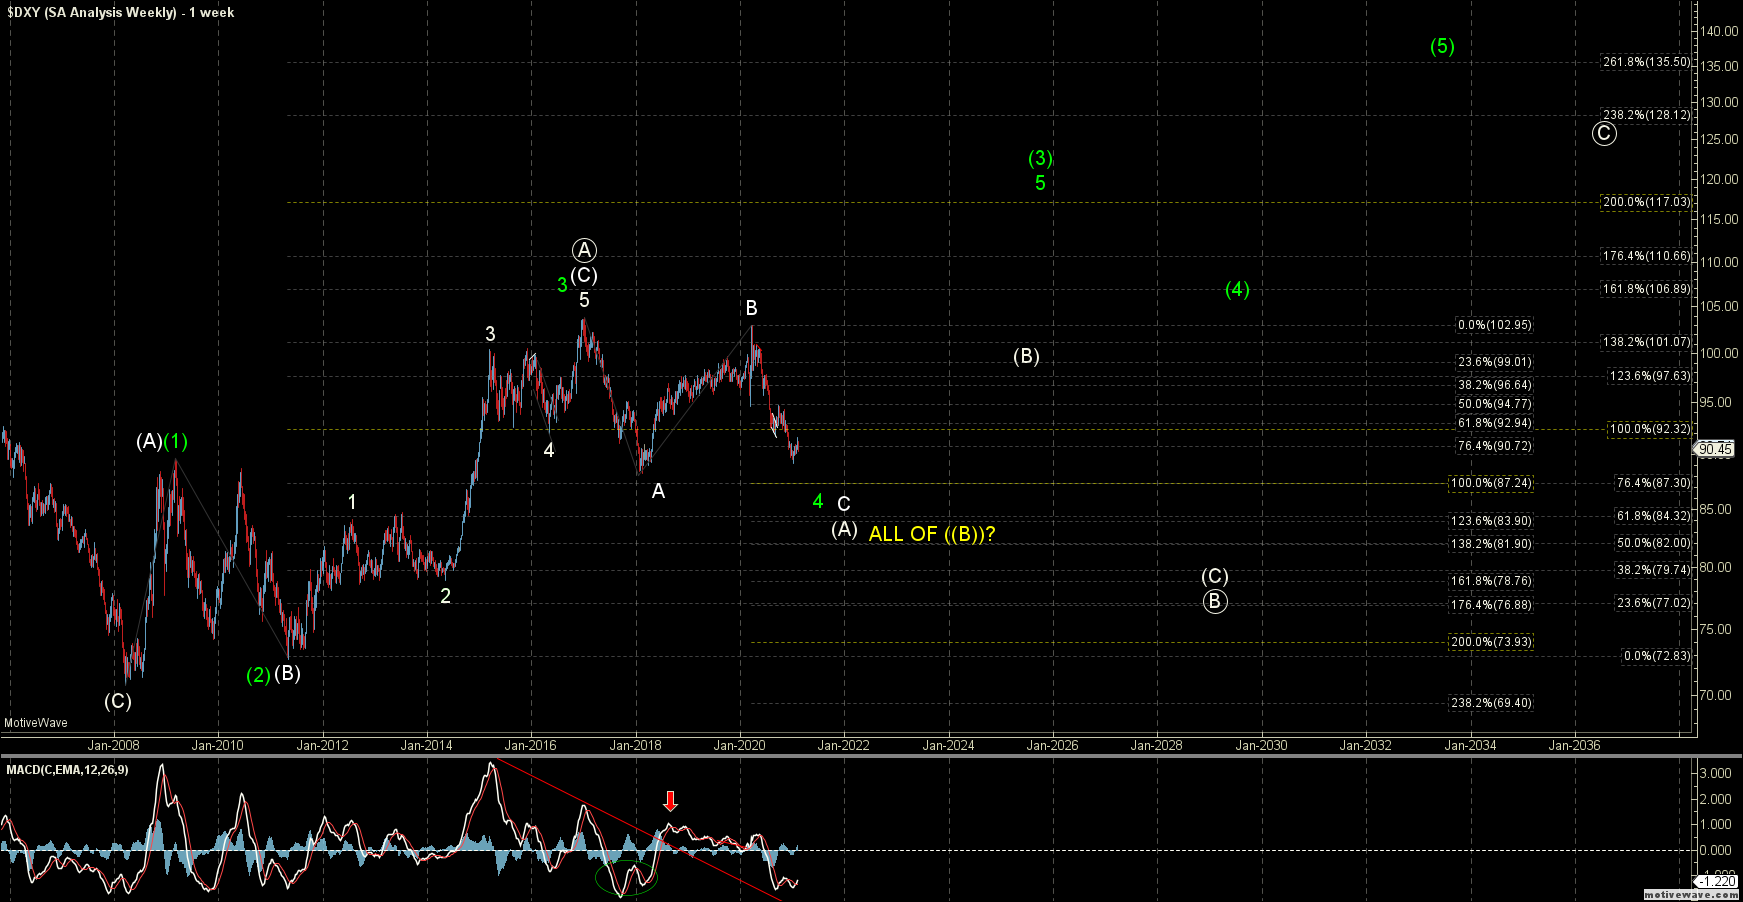
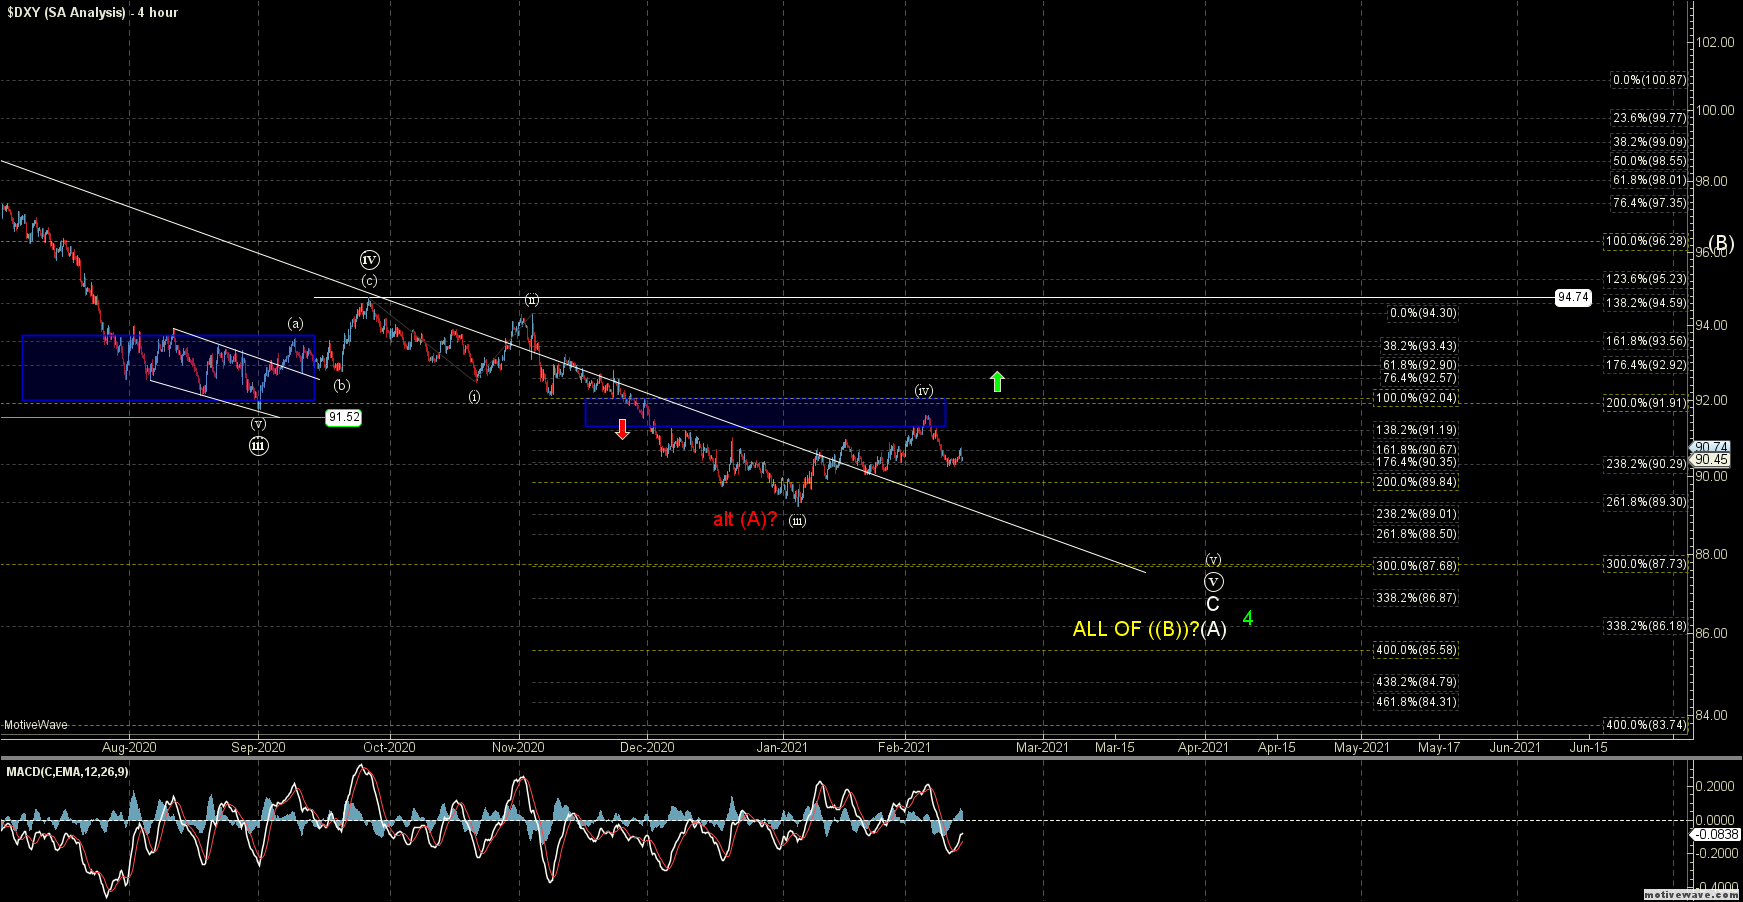
After moving into the middle of the retracement zone last week for our potential wave (iv) the DXY once again moved back down in the direction of the larger degree trend thus so far following the white count that has I have been following on the charts for quite some time.
Again this white count is the primary path forward and is still suggestive that we need to see yet another lower low to finish off the wave (v) of ((v)) of C of (A). As I noted previously so far the structure of move up off of the January lows is still looking like it is taking the shape of a corrective three wave move rather than a five-wave move. The move down off of this week’s high is making this three-wave structure to the upside more probable but we still need a break under the 90.05 level to give final confirmation that we are indeed dealing with a corrective three wave move up off of the lows. The move down off of last weeks high so far is also only three waves however if we can make another lower low while holding under the 90.97 level then we will have what can count as a full five down off of the highs. This would give us further confirmation that we have indeed topped in the wave (iv) and are in wave (v) down likely heading to new lows to finish off the larger degree structure.
The ultimate targets for the wave (v) of ((v)) still come in the 89.01-87.68 zone with resistance to the upside still residing at the 92.04-91.19 zone. As long as that zone holds then we should continue to see this move down into the target zone below to finish off the next major bottom. Ideally, that bottom would only be the bottom of a wave (A) of a larger corrective downside move, however, once we get there and find a bottom we can look towards the structure of the next move up to help determine the overall larger pattern
The green alternate count would still be looking for a wave 5 higher after finding a local bottom but it would suggest that the next move up off of the lows is one degree different from the previous count as I would now count the bottom of the wave 4 at the current low. I still am viewing this as a lower probability pattern but it is the best bullish alternate I can come up with at the moment so I will leave it on the charts for now.
Overall this has still been following our fib pinball path quite well over the past several months which has given us very clear guidance on the direction of this instrument. The divergence that was forming on the weekly chart is still in place as I noted last week so while we may have a bit more downside action to complete the larger degree move the technical signals are starting to develop to help confirm the large degree wave count.