Trend Clearly Down, Though Short-Term Bounce May Be Due
 By
By
In last weekend’s update, we wrote:
We broke down from the triangle we were tracking on ES, tested 2800 support area and are now in a counter trend bounce. Break of 2800 is what the bears need to see to begin the bigger move lower down to 2700 and possibly the 2600-2650 target area for the head and shoulders breakdown. Until then, we can bounce a little bit more up to 2850 and 2860 areas. I do not think we go beyond 2860 but if we do, it means that the market is going for a 2900-2920 retest. My best read though at the moment is that we may trade sideways for a bit more..maybe a little more upside for a day or two but we then move lower for a break of 2800 a little later in the coming week. This break of 2800 area if it happens, would then trigger the next bigger move lower.
What actually happened: There was the sideways action we anticipated on Monday and some of Tuesday before the S&P 500 finally cracked through 2800 support. And here we are now testing the 2730/25 support areas now.
What's next?
Our head and shoulders breakdown pattern targets the 2625 area. And the open interest data we reviewed in the Smart Money room is bearish. However, this is a spot from where a 2-3 day bounce can happen as our daily razzmatazz wave also seems to suggest. Even if we get a quick bounce, the trend is still very clearly down. A bounce back to test the head and shoulders neckline at 2800/2810 area would not surprise me before further downside action.
ES Grey Zone areas: The grey zones on the ES 5 min chart below are what I draw in on a discretionary basis. They are support and resistance areas which the market is most likely to react from. If we test a zone from below, it is likely to be rejected and fall lower to test support zones below. If we test a zone from above, it is likely to take support there and begin a move higher. So these zones can be used for intraday trading and/or as entry points for positioning for swing trades. These zones are drawn in based on what the market has done there previously both on smaller and larger timeframes.
On the upside, we have grey zone resistance at 2761-68, 2797-2805, then 2833-41. On the downside, we have support at 2729-2722 area.
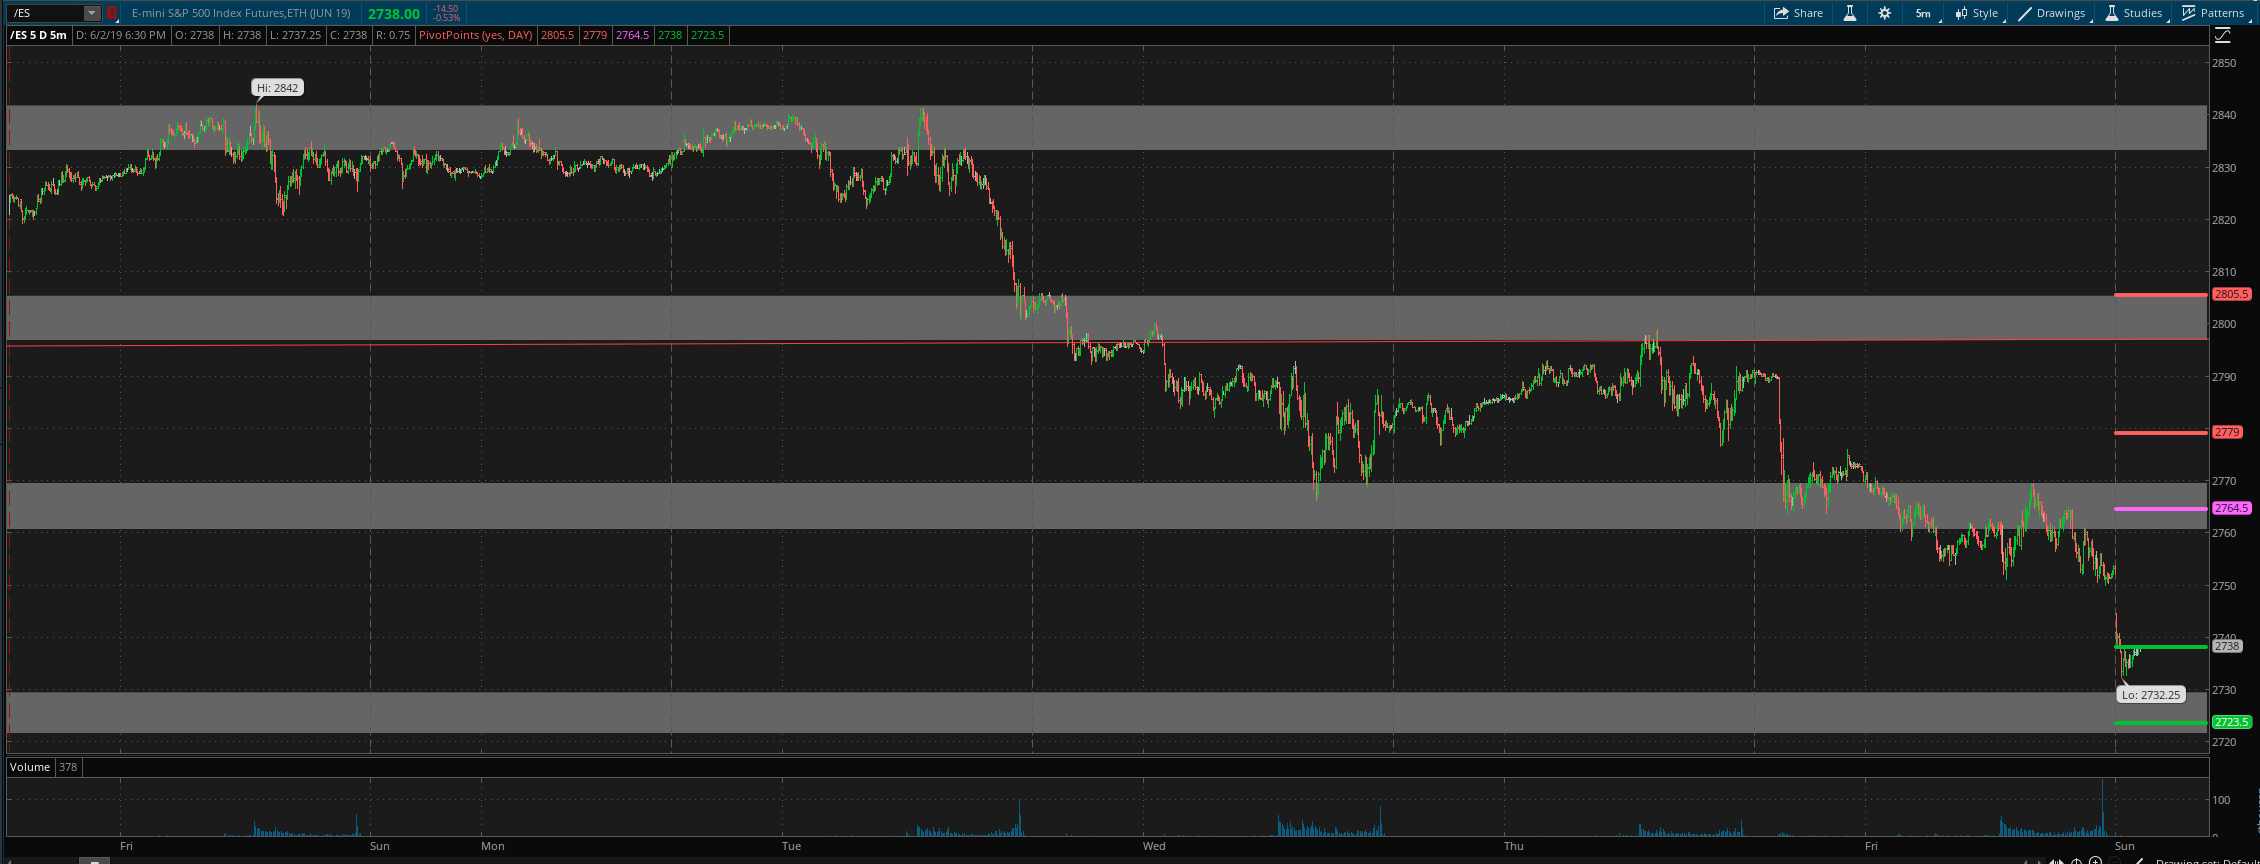
ES daily pivot is at 2764.5. Resistance R1 is at 2779 and R2 is at 2805.5. Support S1 is at 2736.5 and S2 is at 2723.5.
All the best to your trading week ahead.
