This Is Still A Bull Market
It is quite clear and understandable that many of you will become quite frustrated with me when my primary expectation is not met by the market. And, of late, I have been expecting the market to rally to the 4880-4960SPX region before we began a larger pullback in wave [4] of [iii] off the March 2020 low.
As we came into 2021, while many others were looking for a larger pullback, I was quite confident that we would see at least a 20% rally this year, with a minimum target of 4600SPX. You see, my expectation centered around our Fibonacci Pinball views that we would rally in wave 3 of [3] of [iii] for most of the year into the 4440-4600SPX region, to be followed by a wave [4] pullback to the 4270SPX region, thereafter targeting the 4900SPX region to complete wave [3].
The reasons I set these targets was because wave 3 of [3] typically targets the 1.00-1.236 extension region of waves [1] and [2] (4440-4600), with wave 4 of [3] pulling back to the .764 extension (4270), followed by a rally to at least the 1.618 extension (4880). As we know, the market rallied to 4550, pulled back to 4270, and we then rallied to a high of 4744. So, while we have hit almost all our target expectations for 2021, we clearly came up short of the 1.618 extension thus far, as the market seems to have topped out at the 1.382 extension instead.
Again, while the market has hit every target we have set for this year, it is really unusual to top out at the 1.382 extension after the pullback holds the .764 extension. In fact, the probability that we would rally higher for wave [3] was at around 70% last week (and has since dropped to around 55%). And, for this reason, I am still leaving some potential on the chart to still see a rally into early 2022 to the preferred target overhead.
Now, as I started this update, many of you may get quite frustrated with me when the market does not reach all its standard targets, even though it has hit every target to date, other than the ideal wave [3] target. Moreover, if we are now indeed in the initial a-wave of wave [4], the overlapping mess of a wave structure experienced since we topped has certainly added to that frustration. So, I wanted to take a moment to re-assure you of the larger degree expectations before I move into the smaller degree time frames.
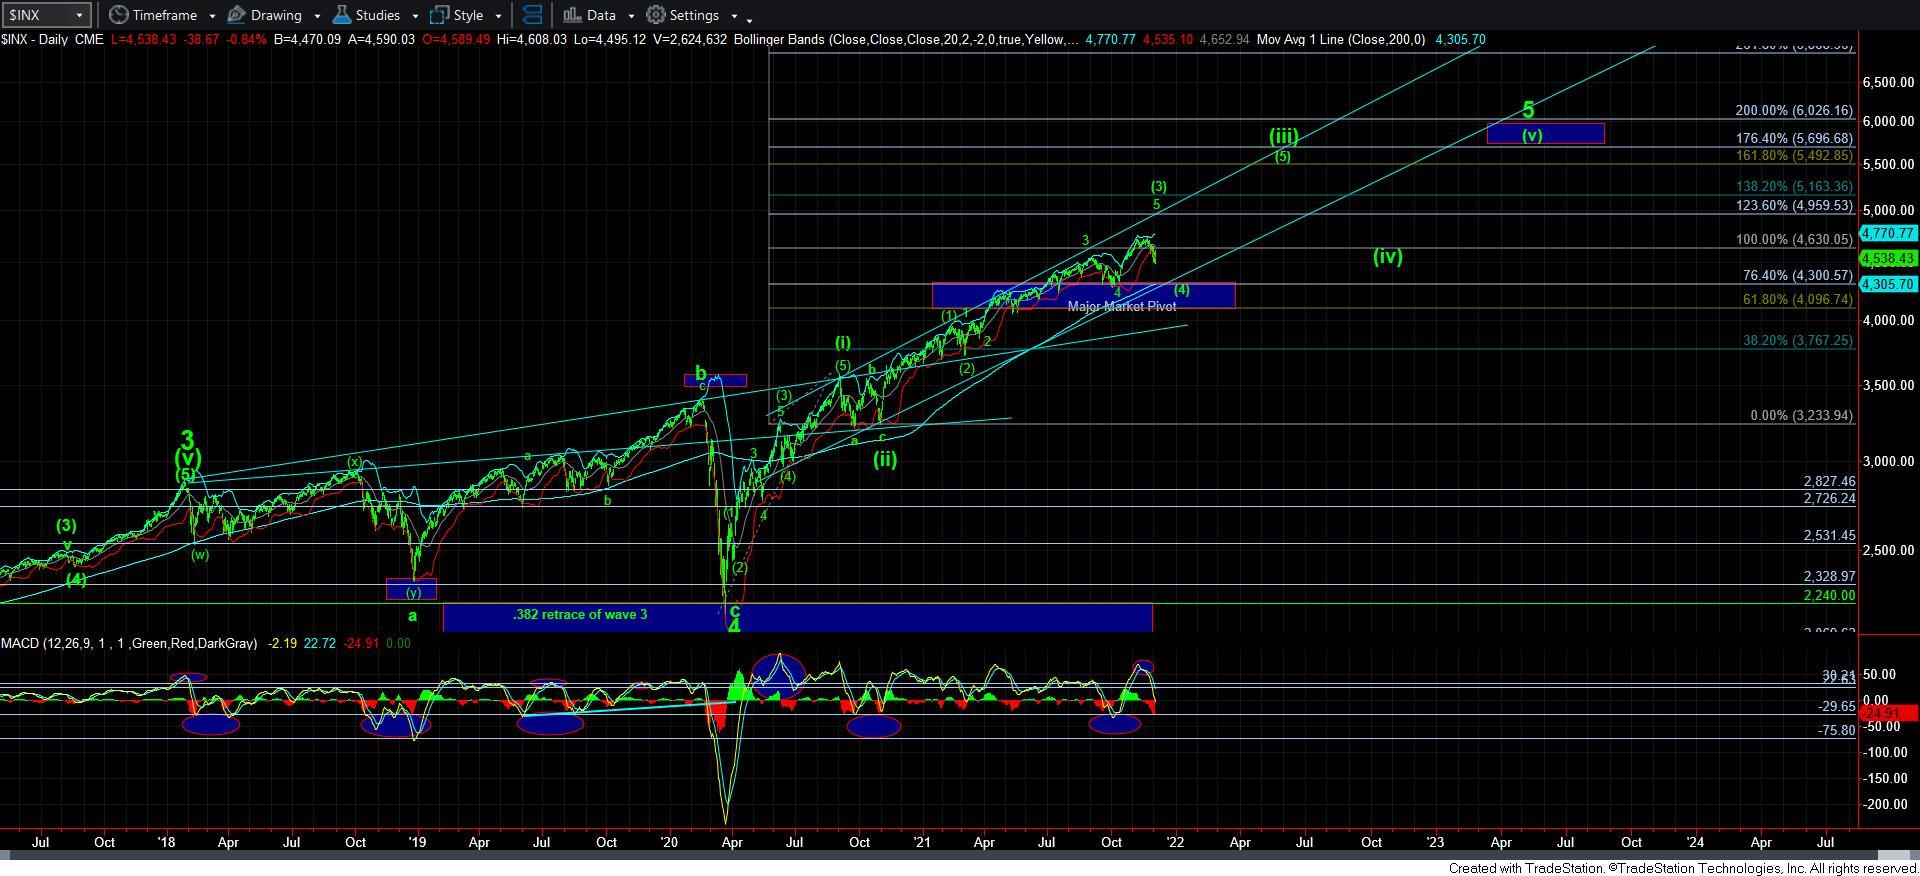
Even before this decline began, I warned you that once wave [4] began, I was quite certain that most pundits would be calling for the end to the bull market. But, in truth, I did not expect it would be seen with the SPX being only 5% below its all-time highs. Whereas I realize that many stocks have fallen by greater percentages, the larger structure in the SPX still suggests this may only be the start to wave [4] within wave [iii] off the March 2020 lows, as you can see on the daily chart.
Again, I am still unsure as to whether the market may still attempt to get to the 4880SPX region before wave [4] begins. But due to the depth of this pullback, the probabilities have clearly risen that we have already begun wave [4]. As I have been saying all week, the nature of the next rally will provide us with a much stronger indication as to whether we have indeed begun wave [4]. Should we see a clearly impulsive 5-wave rally take hold off a low, then I will likely cautiously be looking for that rally to 4880SPX. However, if the rally is clearly corrective in nature, then I will be looking for a set up for a c-wave decline, which will likely be pointing us down to my yellow count wave [4] target in the 4300-4350SPX region.
But, this brings me to the my next point. I still have no clear indication that the current decline off the high has completed. The market is currently in extreme oversold condition, with some indicators suggesting an extreme even relative to the March 2020 low (as unbelievable as that may sound being only 5% off the all-time high). And, while I still have no indication that the bottom to this initial move off the recent high as been struck, it is a reasonable expectation to assume we will see a larger degree “bounce” very soon.
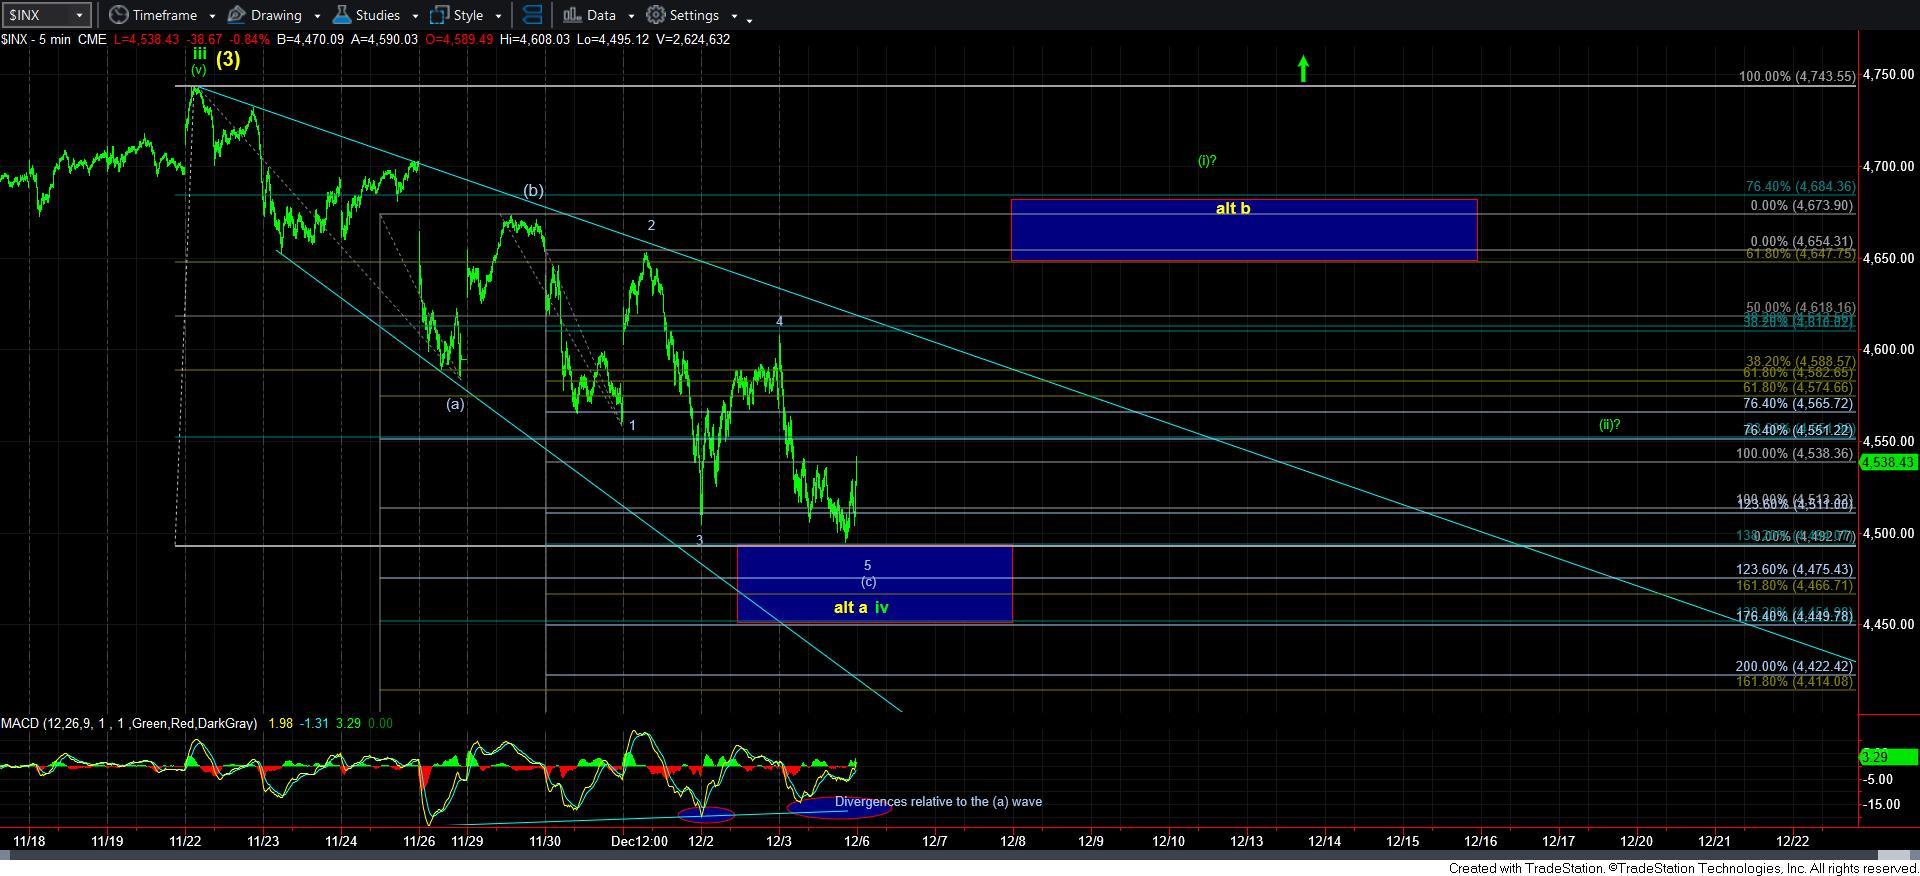
For now, it leaves me with a lack of clarity when it comes to the micro structure of this current decline, which is quite typical of corrective declines. Normally, whether this would be an a-wave to wave [4] or even if this is still wave iv of [3], we would see an a-b-c downside structure, with the c-wave being a 5-wave structure. However, at this point in time, the only way I would be able to see such potential is that the c-wave would have to be counted as an ending diagonal, as shown on the 5-minute SPX chart.
But, the hallmark of an ending diagonal is that when it completes, we often see it spike down to completion, followed by an even stronger spike back up which initiates the next rally. I am not confident that I have seen that yet. On Friday, as we were approaching the lows of the day, I outlined that I would prefer to see that spike down to completion, followed by a strong move through the 4535ES region in impulsive fashion. If I would see a 5-wave rally through that resistance, it would give me a bit more confidence in the green count pointing us up to the 4880SPX region. However, while the market did reverse strongly off the low at the end of the day, I did not see an impulsive break out through the 4535ES region. In fact, the futures closed just below that level. So, at this point in time, I am not yet confident that the initial move down off the recent all-time highs has completed. Nor am I confident yet as to what the next rally will represent as the structure is not clear just yet.
I know you want to hear words of “certainty” from me in my analysis, but I must be honest with you, as well as myself, when it comes to what the market is showing me. I am only able to provide clarity to you if the market provides it to me. And, until we have strong evidence of a bottom being in place, with clear insight regarding the structure of that rally, I am unable to provide to you a higher probability view with regard to whether wave [3] has indeed topped in shortened fashion. While I can say that the probability that wave [3] has ended has certainly risen due to the break of the 4540SPX support this week, the fact we have only struck a high at the 1.382 extension rather than the standard 1.618 extension still leaves me wanting for clarity on that question as well. So, the nature of the next rally will settle this issue for me.
I want to remind you what Frost & Prechter noted in The Elliott Wave Principle:
“Of course, there are often times when, despite a rigorous analysis, there is no clearly preferred interpretation. At such times, you must wait until the count resolves itself. When after a while the apparent jumble gets into a clearer picture, the probability that a turning point is at hand can suddenly and excitingly rise to nearly 100%.”
I am currently at this juncture. And, I must await the next rally in order for the market to clarify its near-term intent, and whether it still has designs towards 4880SPX before heading much lower, or whether wave [3] indeed topped in a shortened fashion.
I want to also take a moment to note that the divergences and extreme oversold conditions we are seeing in the market make it ripe for an extremely strong rally to take hold at any point now. And, it is clearly evident even down to the 5-minute SPX chart, where we are seeing significant positive divergences in this overlapping decline relative to the initial [a] wave move down off the recent highs. So, again, I still view it to be reasonable to expect a rally to begin in the coming week. And, the nature of that rally will tell us whether we have to prepare for a c-wave down to the 4300-4350SPX region, or whether new all-time highs can be seen sooner rather than later.
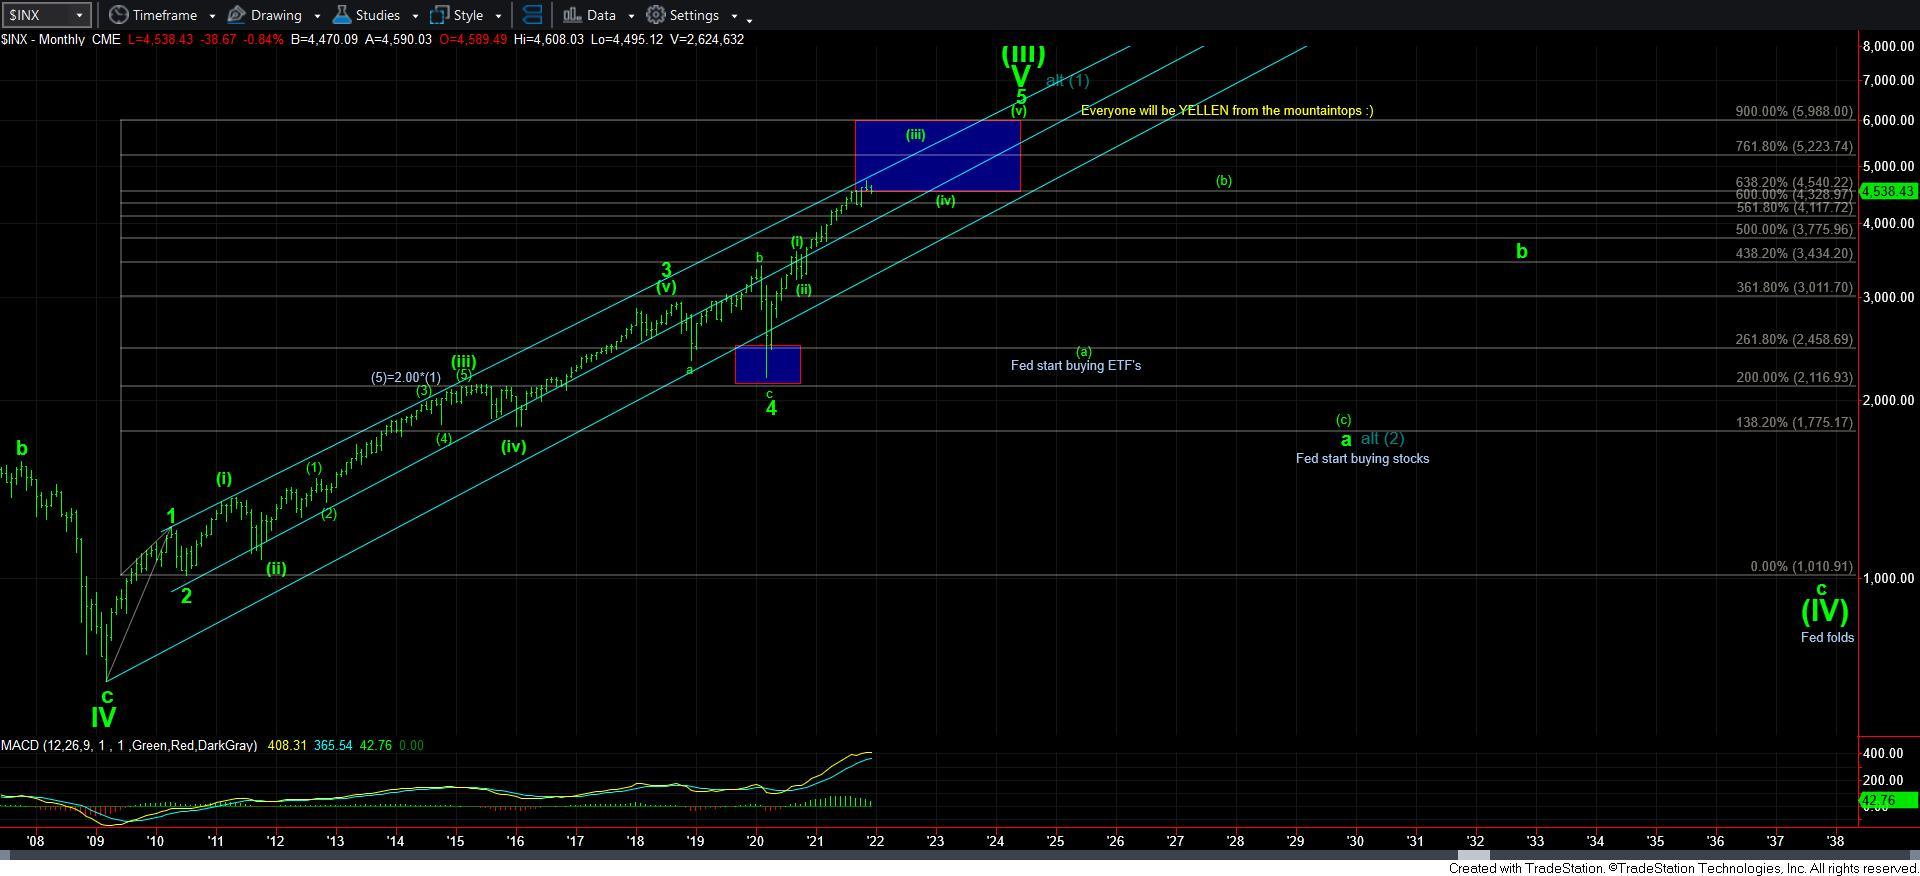
In conclusion, I want to reiterate again that this is still likely a bull market with much higher levels to be seen. When we were down in the 2200SPX region, and many were strongly arguing with me that the bull market is dead, I still maintained a strong conviction that we were about to begin a rally to 4000+, with an ideal target in the 6000SPX region, all based upon our larger degree Fibonacci Pinball structure. And, even before the current pullback began, I warned you that many would be viewing this pullback as the start to some bear market. And, the closer we get to completing wave [4], the stronger their conviction will become, and I am sure many will be arguing this point with me again.
Not only am I not looking at this pullback as the initiation of some bear market, but I still view it as a high probability that we will see a strong 2022. Again, while I was still bullish off the 2200SPX region when we were at those depths of despair in March of 2022, I even was so bold as to claim that 2021 would be another banner year for the stock market with an expectation that the SPX can see a 20%+ continuation rally. And, I will boldly state that I think we can see a 15-20% rally in 2022 as well.
You see, in the bigger picture, we are still within a larger degree wave [iii] off the March 2020 low. And, 3rd waves are the strongest segment of a 5-wave advance in an equity market. Moreover, the next larger advance I expect in 2022 will likely complete wave [5] of [iii] off the March 2020 low. So, while you will undoubtedly be bombarded with many “beliefs” that the bull market is over, I still maintain a high probability expectation that 2022 will see further gains in the market, with potentially broader participation.