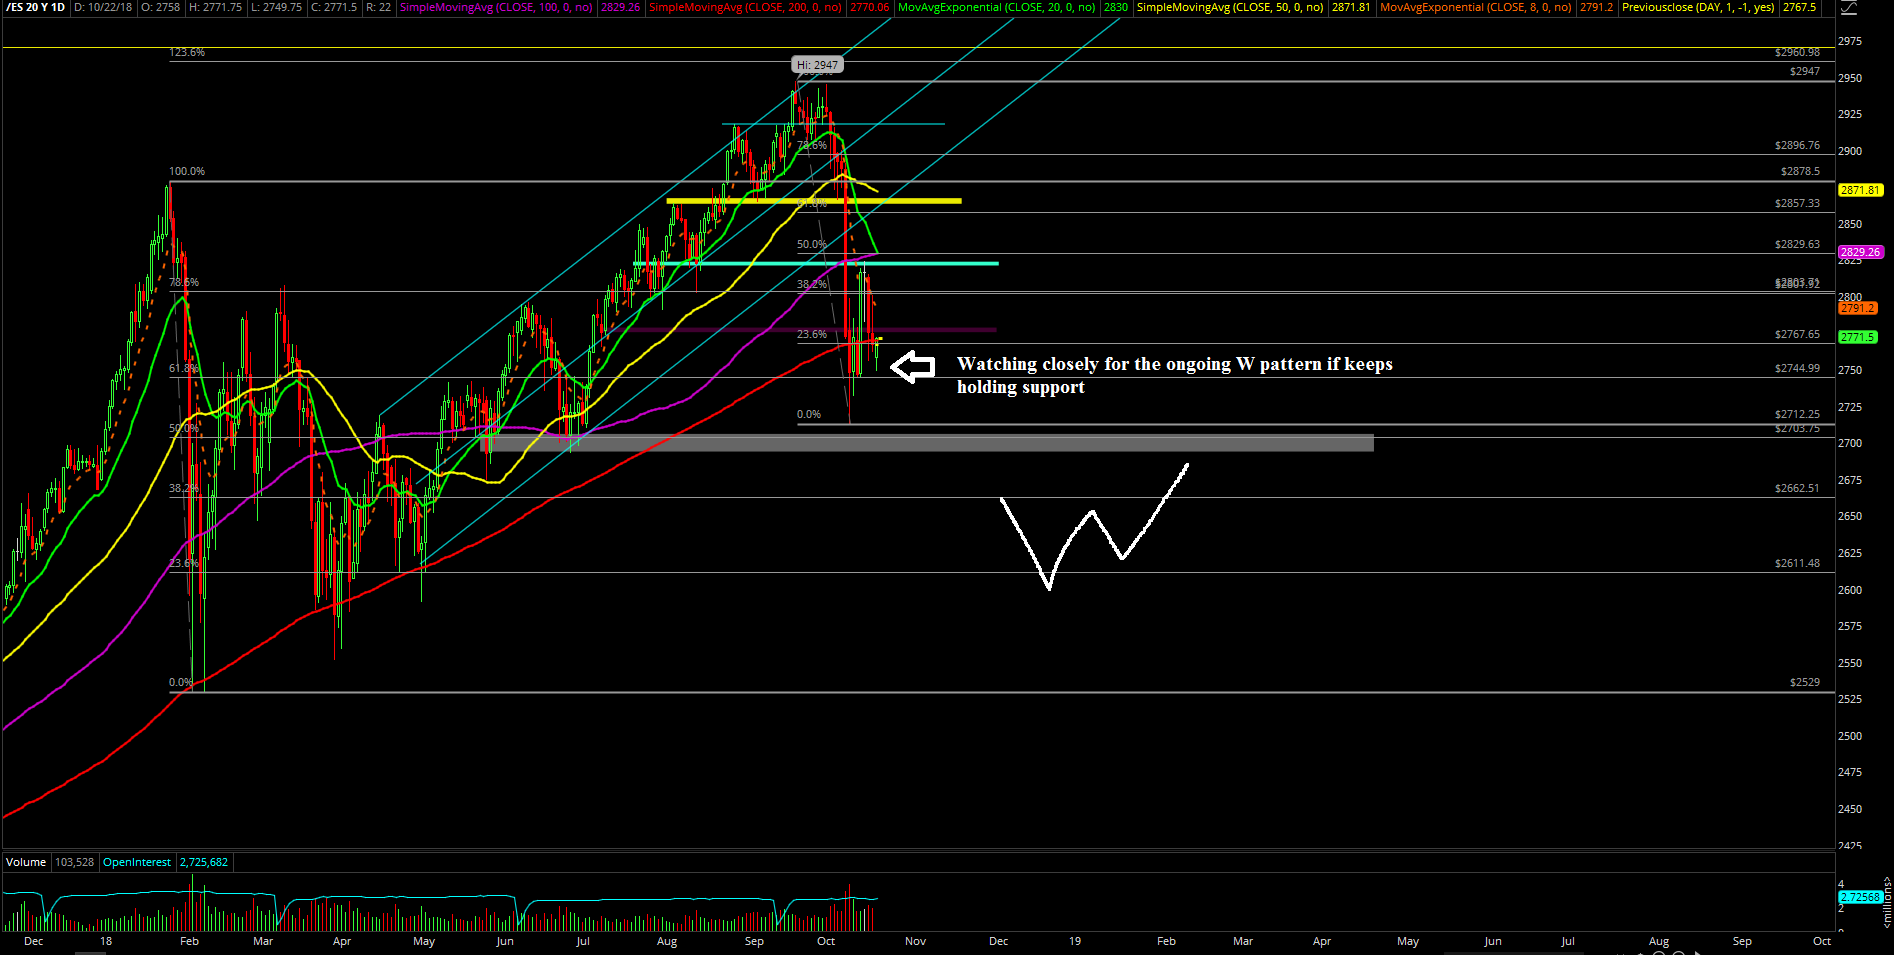
Stabilization Continues with Ongoing W-Shape Reversal Pattern
 By
Ricky Wen
By
Ricky Wen
Last week’s action was an 80-point inside week that consolidated within the bottom half of the Oct 8 week’s massive breakdown range of 2900 to 2712.25 on the S&P 500.
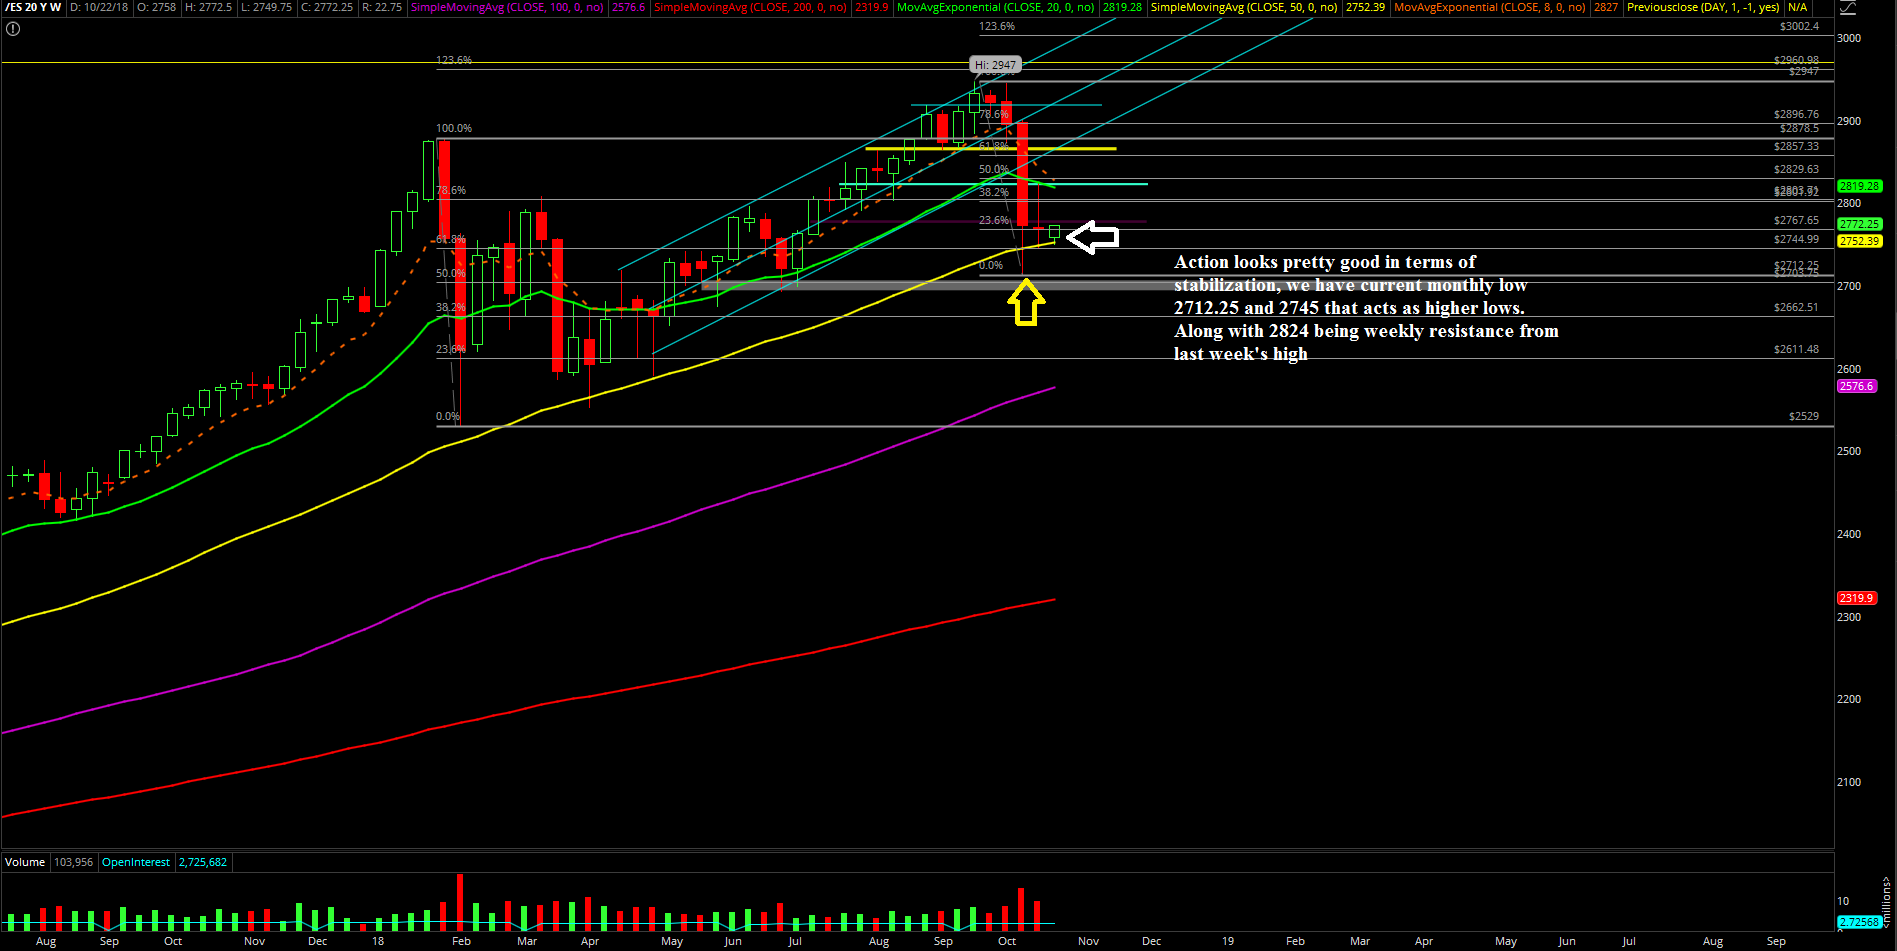
Basically, the price action was able to stabilize with the week’s low at 2745.25 versus the prior week’s low of 2712.25. As mentioned in prior reports, we’re watching the bigger picture as some sort of ongoing W-shape reversal pattern on the daily chart as long as support keeps holding and not giving back a full retracement below 2745, as that would be way too bearish.
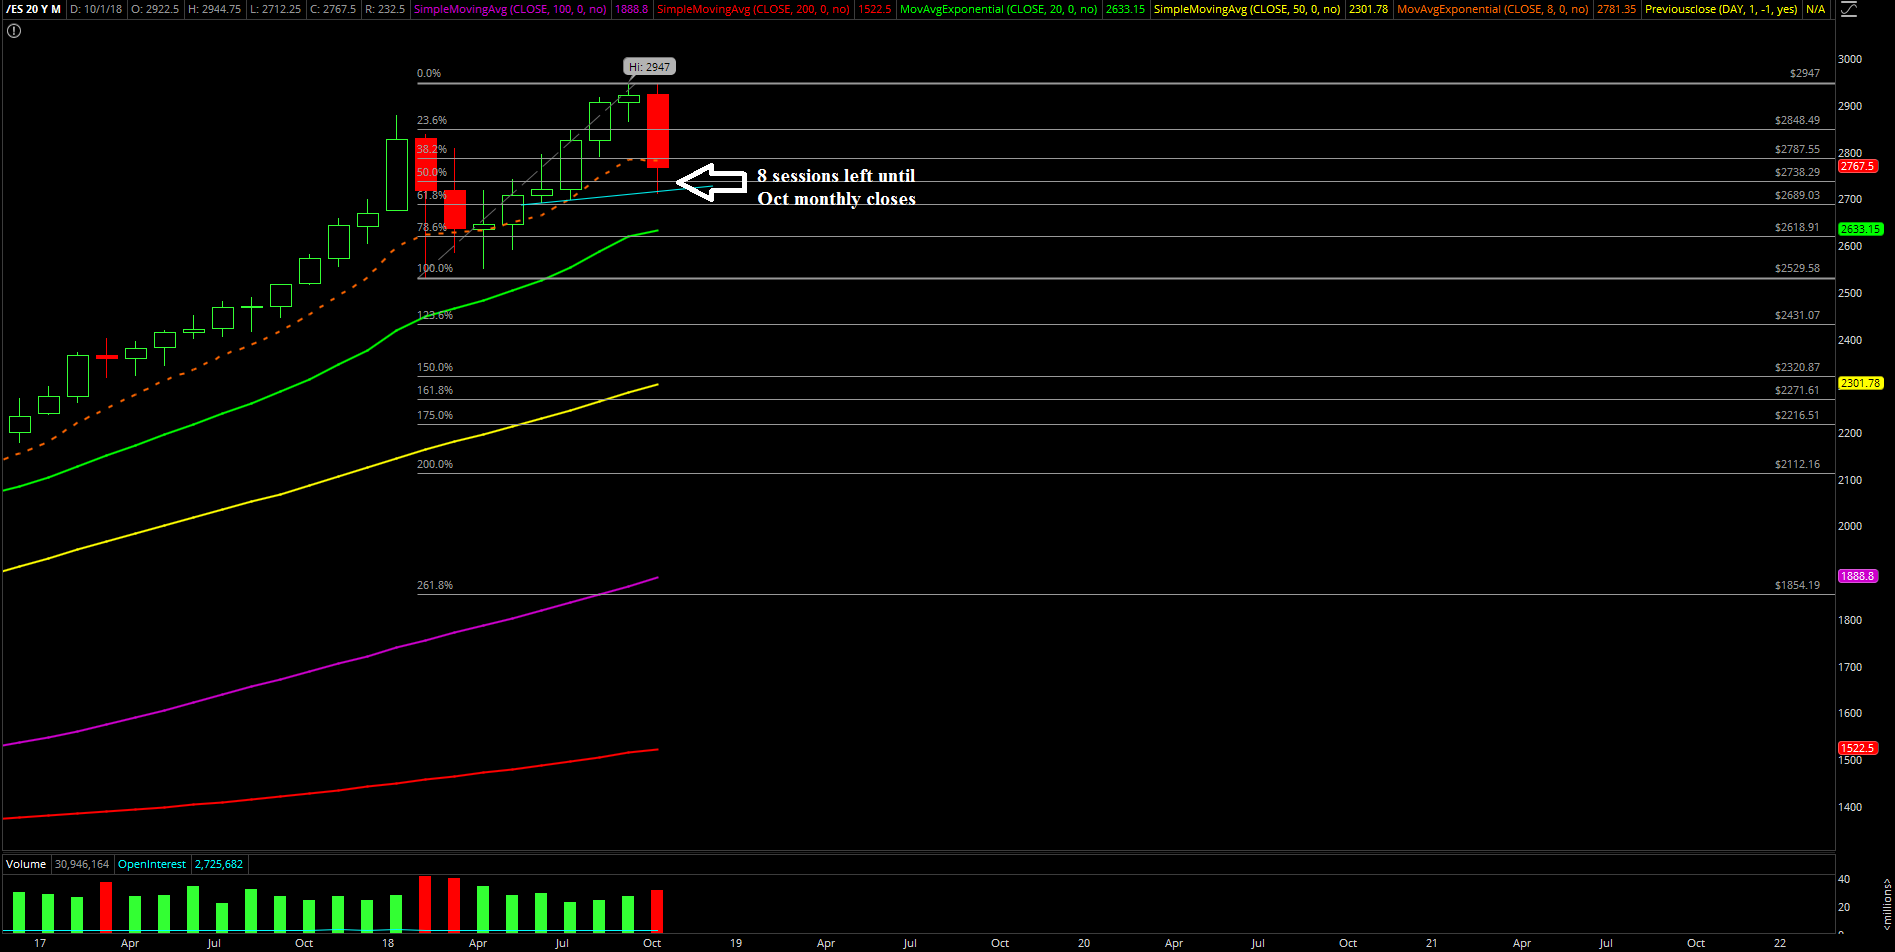
The main takeaway from the week is that price has stabilized temporarily for now, and we have some key levels as references with the current higher lows. The market has an overall range of about 80 points for the time being. Basically, the threat of a prolonged correction is slowly dwindling down if price action keeps stabilizing here along with the fact that traders may have to be cautious for another inside week or two given the pattern.
What’s next?
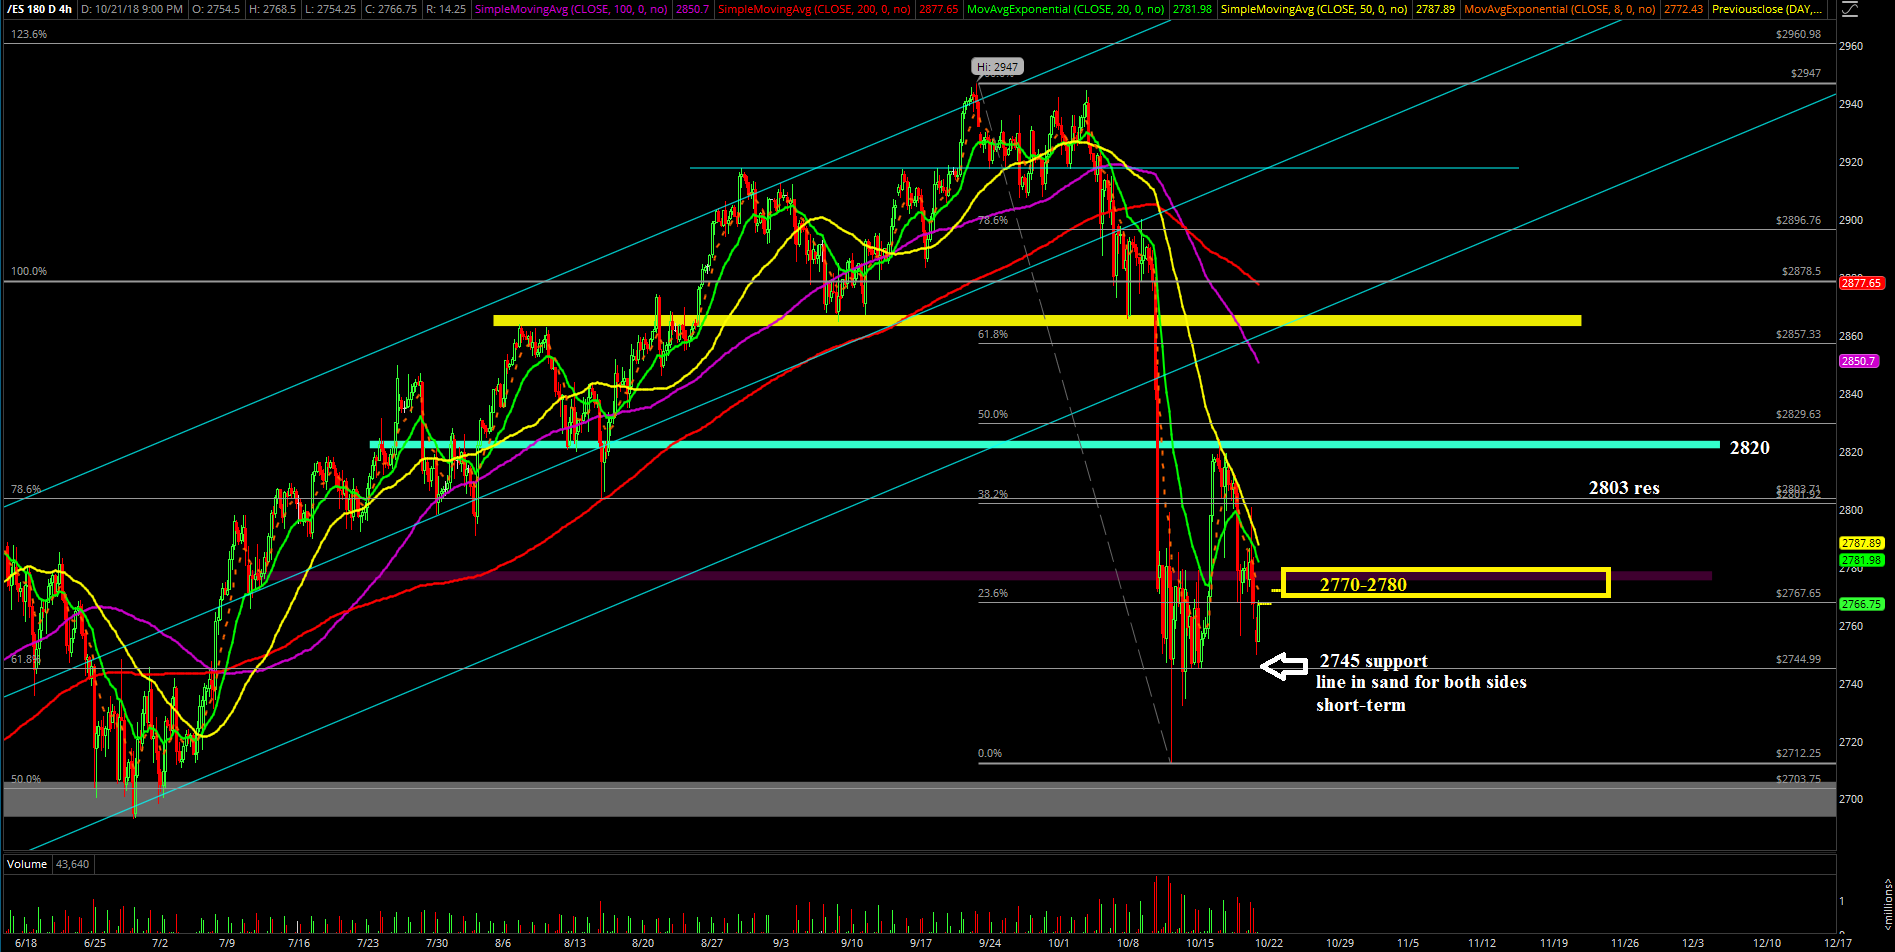
Friday closed at 2767.50 and as of writing price is back to hovering inside one of the key 2770-2780 support regions. Price action temporarily overshot it on Thursday/Friday but the bears failed to do a full retracement to 2745 as bulls keep sticksaving the pattern.
As mentioned previously, we’re maintaining the thesis/context of the bigger picture playing out in some sort of ongoing daily W-shape reversal pattern after the V-shape reversal from the 2712.25 current monthly low. On the micro side, a lot of work needs to be done like retaking the 2803/2820 key levels to really enhance odds and erase all doubts as the bulls regain full control of the train to launch back to highs like the 2850-2865 area or even the prior ATH. We're definitely not out of the woods if price action keeps hovering around 2770-2780 for another day or two.
Conversely, if bears are for real then they need to show up by breaking down below 2745 in order to force a full retracement that would immediately open up 2730/2712.25 levels and then possibly the major June lows area around 2693. Again, this would be the threat of the prolonged correction if the ongoing stabilization fails to gain anymore traction and price action needs to go lower to test bigger supports and attempt to catch a bid again.
Overall, traders need to be cautious of getting shaken inside an overall inside week range given the massive range expansion from the breakdown during the second week of October. You have to stay really nimble trading in this environment; either keep taking calculated shots at our key levels like last week or remain in cash and await for more clarity when there’s not much to be had in terms of an edge.