MarketMood Wednesday: Roller Coaster Rides
 By
By
Where We've Been:
There was no MMI daily call for today. The market closed only slightly down, well off the lows of the day.
Where We're Heading:
Next week (week of July 12) could be pretty intense, but this week is quite ambiguous as far as daily MMI signals. Wednesday is showing as a flip from down to up, and may look a lot like a roller coaster ride. There is no call for Thursday or Friday
The long and medium term trend indicators remain bullish, although currently by only a hair. It would take a solid break below the bull / bear trend line to signal that even a temporary pullback has begun.
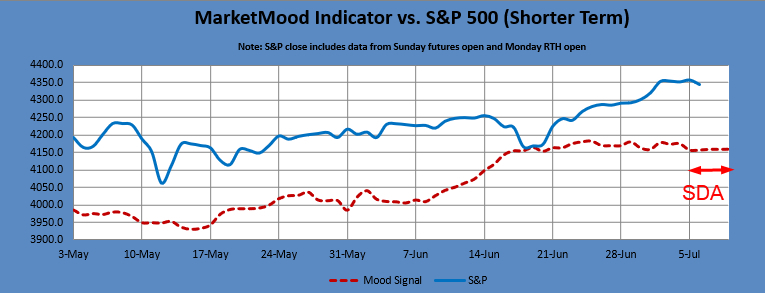
Sharp Drop Advisory: The chart is showing suspiciously flat+overbought through Friday which would generate a sharp drop alert. However, with a local topping process as the weekly forecast, and a flip from down to up in the daily forecast for tomorrow, I would be careful about getting too excited about a selloff quite yet, especially while the market is above the bull/bear trend line.
Internet search theme source data for MMI inputs: men, sports, winners, celebration, freedom, nostalgia, calendar
Next 3 Days:
| Date | Daily MMI | MMI 2* |
| 7/7 | flip down to up | - |
| 7/8 | - | - |
| 7/9 | - | - |
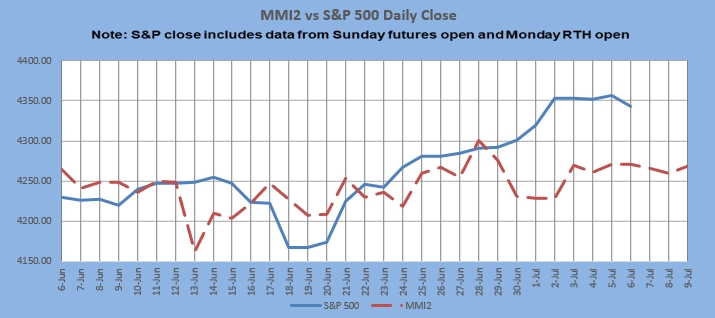
*MMI 2 uses an alternate dynamic algorithm to convert the same sentiment source data to S&P direction as the original MMI algorithm.
Latest charts follow the summary table.
MM Indicators and Trading Parameters Summary:
| Indicator | Scope | Direction |
| LTTI | Longer Term Trend | Bullish |
| MMTT (main) | Medium Term Trend | Bullish |
| MMTT (HP) | Medium Term Trend | Bullish |
| MMTT (b/b) | Near Term bull/bear Trend Line | 4336 SPX |
| MM MACD | Swing Trade | NONE |
| MMI | Next calculated daily sentiment bias | down to up |
Note: Medium term is roughly 1 week to 2 months. Longer term is roughly 1 month to a year or more.
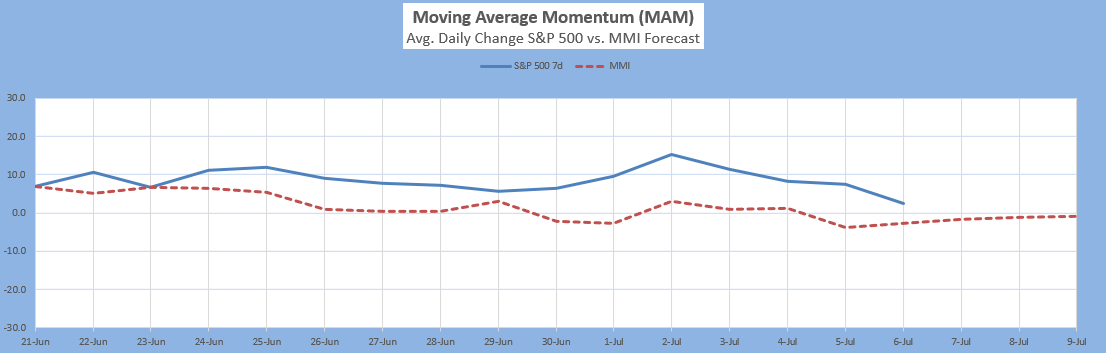
The Moving Average Momentum (MAM): It's been quite a long time since there was a normal major high or low signal. the indicator's last major low signal was 24-31 Dec., 2018. The market rallied strongly following the close on Dec. 24 which fulfilled the major low signal. There was an ambiguous low signal from 20-27 Mar. 2020. It was a combo major low and minor high in the same region. The market did make a substantial low in that time-frame. The last major high signal prior to March of this year was 8-27 Jan. 2020 (possibly the longest window ever). The closing high in that window was 3330 on the 17th then again 3326 on the 23rd. The S&P 500 dropped about 100 points from there through end of month, which was the largest drop in some time. The market then rallied through February 19th to 3386, 60 points above the last high. That was the actual high point, about 3 weeks past this 3 week window. It most definitely was a major high point as it was followed by a steep drop of almost 1000 points before a closing low on March 23, 2020. The most recent major high signal was 10-17 March. The closing high on March 17th was followed by a decline of less than two weeks which was highly unusual for a major high/low signal.
Current status: neutral
Intermediate Term Forecast:
There is a new Big Picture Update video available: July and Beyond. The market should be shooting for a local high this week followed by a pullback on some level. Overall the larger trend is bullish and the market is assumed to be striving for a breakout of the 4400 SPX resistance region. The remainder of the year the market should be in a topping process getting ready for a good pullback in early 2022.
MarketMood Trend Trader
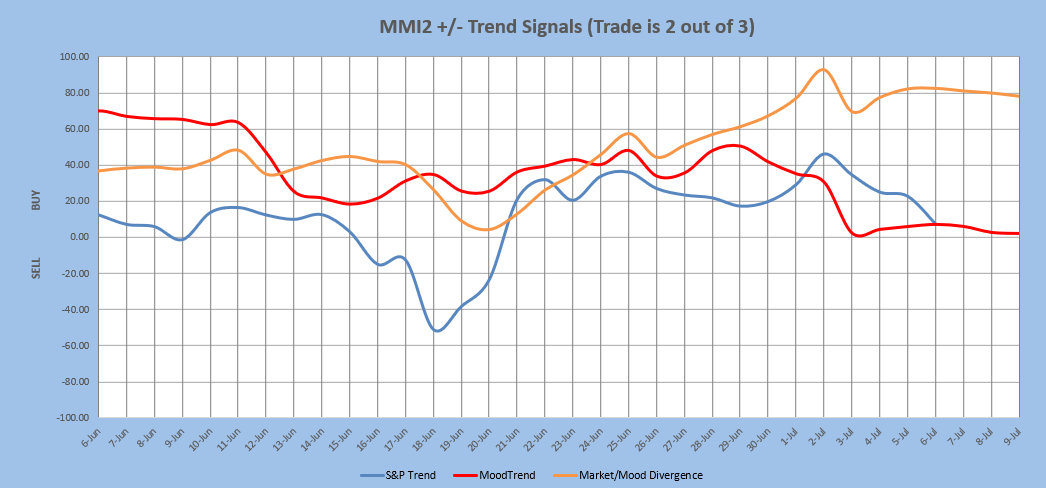
The chart below uses three sentiment trend lines to generate a swing trade signal of BUY if 2 out of 3 are greater than 0 and SELL if 2 out of 3 are less than 0. Trade length averages 9 days, but can be as short as 1 and has been as long as 60. The signal is updated each day after market close. Back-testing shows this signal averaging about 12 SPX points per trade over the last few years. Back-testing a higher probability signal derived only from the two mood related trend lines averages 33 SPX points per trade, but only initiates trades about once every 3 weeks. Note: past performance does not guarantee future results.
Current signal: BUY since 20 May. HP signal: BUY since 11 June.
MM MACD signal is SELL and the intermediate trend is UP. There is no swing trade signal.
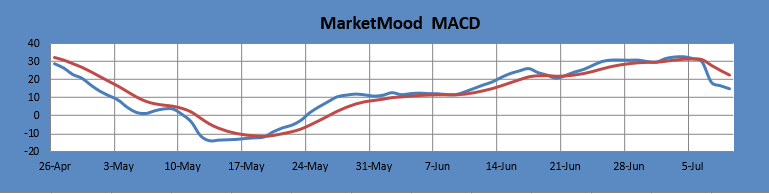
The MM MACD is similar to a standard MACD, except that it uses the MMI signal data to extend several days beyond today, while the standard MACD relies solely on historical market data.
Long Term Forecast:
The long term trend is indicated by the general divergence between the stock market and the mood generated forecast (see long term chart below). The MM Long Term Trend Indicator (bottom chart) which is derived from this divergence, indicates: "Bullish Trend, hold long long-term positions." The MM LTTI has had this indication since 4 Nov 2020.
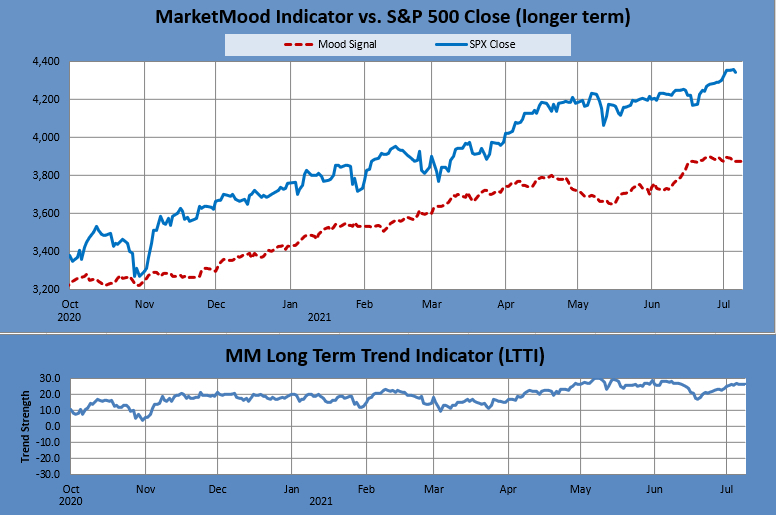
The MM LTTI measures trend strength using the divergence between the market trend and the forecast trend.
For the Extremely Curious:
In normal mode, the top of the mood chart is primary, and in inverted mode the bottom of the chart is. Inverted mode is currently assumed to be in effect. A reversion to normal is expected sometime tomorrow.
Tomorrow's market mood and news themes: big decisions
Tomorrow's trader context is: serious matters, responsibilities
Limitations:
MMI does least well in these conditions-- 1) EW 4th wave, 2) EW b wave, 3) Diagonals, and 4) Topping. More than one of these conditions concurrently present will further diminish performance.
Note: Changes to next day MMI signals occur about 5% of the time, and will be announced in updates as well as the daily report should they occur. Same day signals will not change. Day 2 and 3 signals reflect the most current information, and are subject to change. The default trade per the daily signals is executed at market on close. except on Mondays, as there is a signal for Monday open (i.e. "weekend close") and Monday close. Historical data implies that the daily MMI signals tend to be correct as daily direction calls about 63% of the time over the long term.
