Longer-Term Open Interest Data & Price Action Bullish
 By
By
The Emini S&P 500 (ES) last week held our bullish important support zone during the pullback and rallied to close higher close to unchanged on the week. As a reminder, here's what we wrote in last weekend's update:
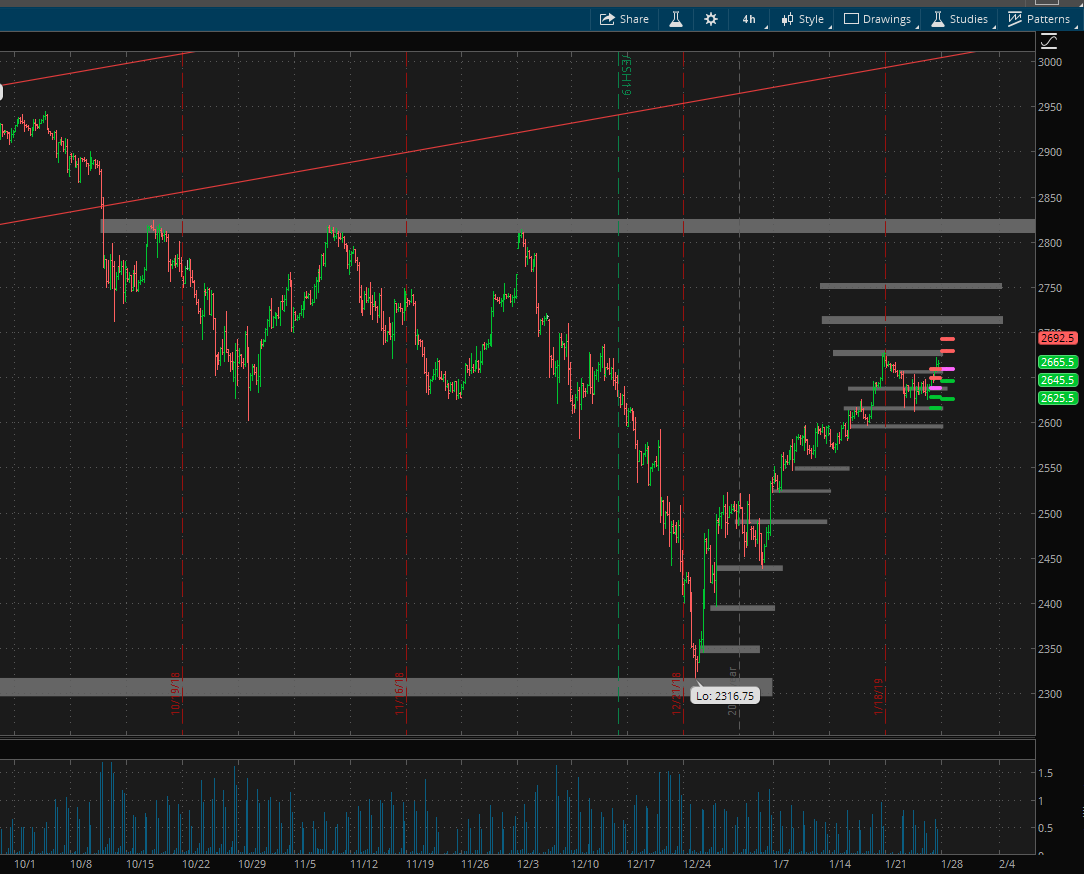
Easy part of the immediate move higher is most likely done. Next resistance up is the 2710-20 area. Breaking through this should get us up to 2770-90 area soon. And note that this is right below our big big resistance zone of 2800 - this is where last two major advances stalled and reversed hard. So that is the last defense of the bears… but that is looking too far ahead. For the week ahead, it is likely we hit resistance right around were we are right now at 2680 and pullback or we hit a little higher into 2710-20 zone and then pullback before advancing further to the next target zone of 2770-90. On the downside, pullback targets are first 2640 and then 2625. 2600-2580 was our important resistance zone until last week and now that we are through it, it is now important support and from my perspective - as long as the bulls hold this zone, they have the upper hand.
Post Opex adjustment got us our pullback to 2640, 2625, but could not quite make it to our bull support of 2600.
What's next?
On the open interest front, we had a lot of interesting developments during the week. In the middle of the week we had a lot of shedding of open interest, more in calls than in puts, and this pushed up our "Scary Guy Put Call Ratio." Then Friday’s data indicated short term is kind of bearish, but March added a HUGE amount of puts at 2400, 2500, 2600 etc. This is support for the market and implies we are not going to see lower lows than what we saw in December. Of course, anything can happen in the market, but this is what the data is implying for now.
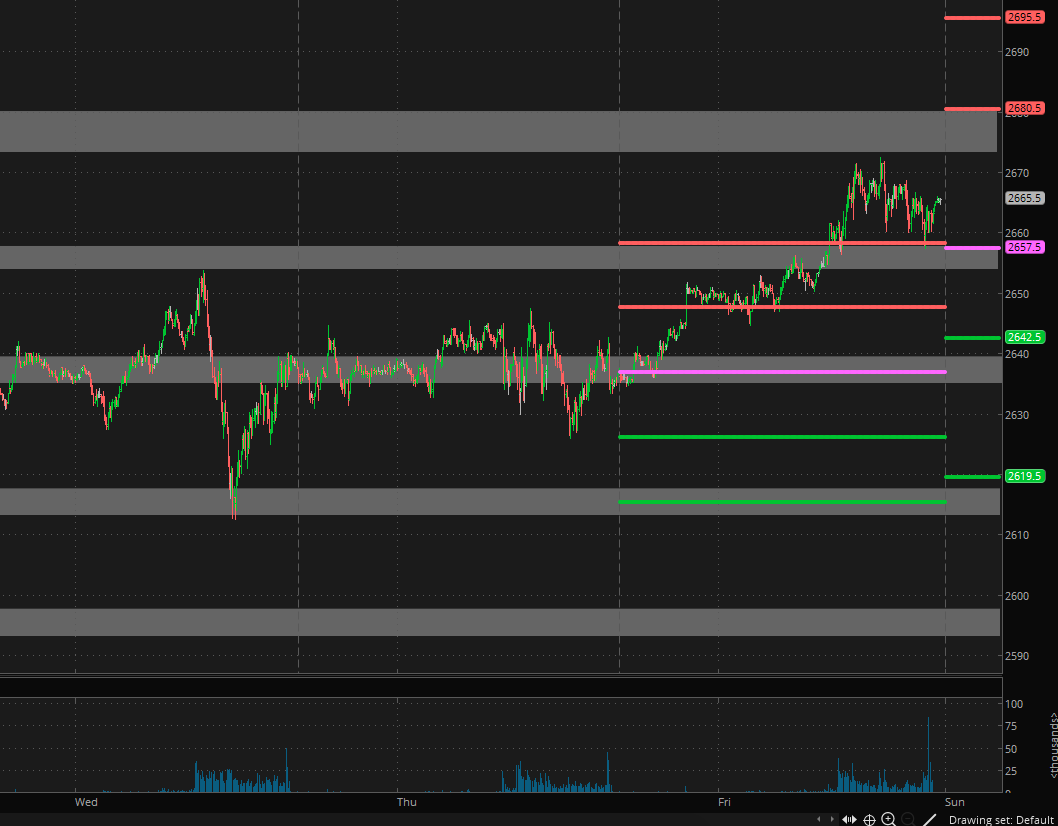
Short-term data on open interest is kind of bearish, so we may get some more weakness early in the week. But at the same time, longer-term data is bullish. Price action is also bullish. This suggests that we exceed the highs at 2677.75 sooner rather than later. Breaking through that number opens up 2750 as a target, which is one spot I am eyeing to take at least partial profits on our long position entered on the Jan 14th NYHL1M buy signal so that we can re-enter later.
ES Pivots: Daily pivot is at 2657.5. Resistance R1 is at 2680.5 and R2 is at 2695.5. Support S1 is at 2642.5 and S2 is at 2619.5. Gray zone areas - we are in resistance in this 2672-80 area, second area is at 2710-20. On the downside, we have support at 2639-35, then 2617-14.
All the best to your trading week ahead..
