Internals Weak Compared To Price
 By
By
Options data is bullish on review today. Internals are mildly bullish. Price action is short term bullish, medium term bullish and long term bullish.
Weakness into Thursday got us out of longs as we lost all indicator support for the long side. This continued to be the case in spite of the rally on Friday.
Internals continue to look weak compared to where we are on price. After weakness into Thursday, price recovered completely to end the week at the highs. Price can continue a little higher, but I am expecting to see a deeper pullback develop very soon.
In the Emini S&P 500 (ES), 4370/80 area is one spot from where this can happen, but if exceeded the 4400/4410 area is likely to be hit before the pullback. Right now, we are flat in the market with indicators not supporting either the long or the short side. We should get more clarity in the coming week on what next. Either we will get an Odds sell signal, which will get us into a short trade, or the indicators will reset, pushing us back into a long trade. It may however take 2-3 days before either of the above can happen..
Grey zone resistance at 4372-79 and then above 4400. Support is at 4353-46, 4325-20, 4307-01 and then at 4286-78.
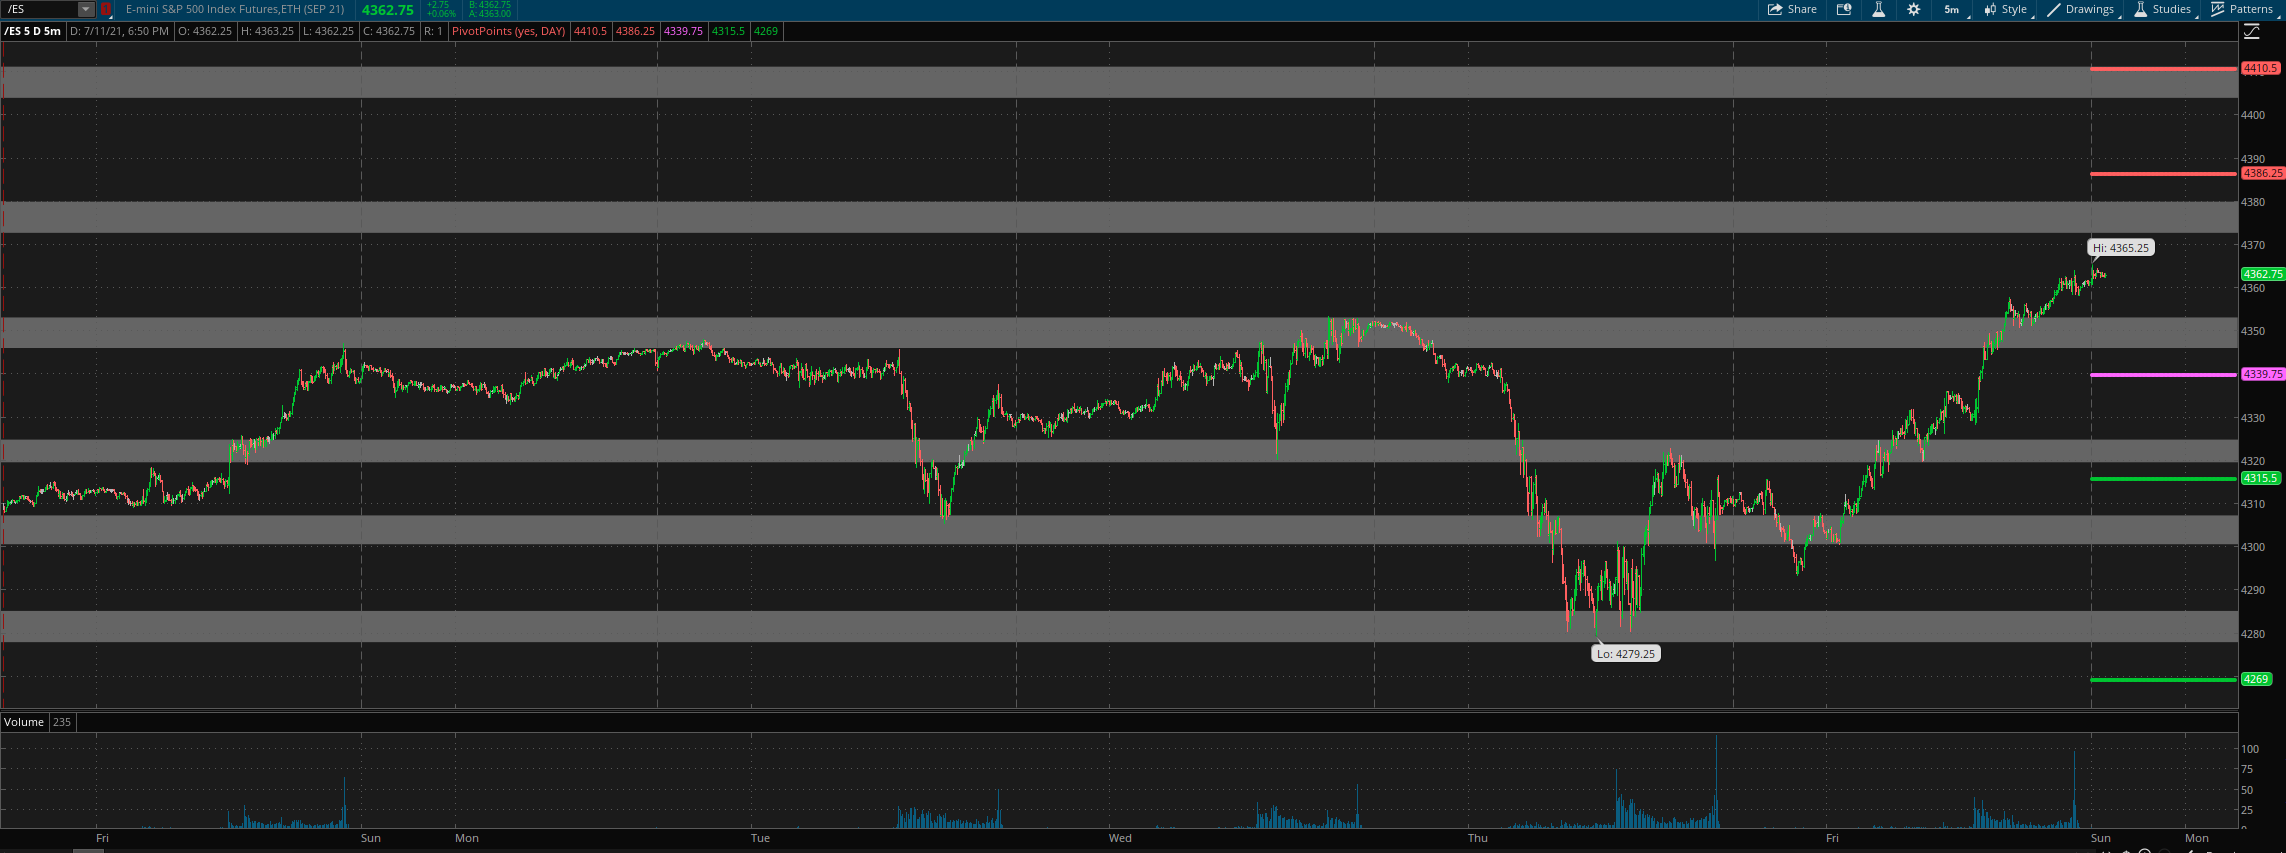
For Monday, daily pivot is at 4340. Resistance R1 is at 4386 and R2 at 4410.5. Support S1 is at 4315.5 and S2 at 4269.
All the best to your trading week ahead.
