Bullish Short-Term Indicators, but No V-Shaped Recovery In Sight
In last weekend’s update, we noted:
All the smart money room models except the micro1 indicator are currently bearish. Internal data was not bad on Friday when compared with price. This is suggesting that we get some kind of move higher very soon. But this is likely to be just a bounce based on how the bigger picture indicators are looking right now. It is going to take a lot of time, backing and filling, to resolve the technical damage we have on the charts right now even if we seem to be very close to an upward correction in price. Cash is still a good position to be in right now until we get some more clarity.
What actually happened: We did get a nice move higher during the week as the internals were suggesting.
What next?
Right now we have couple of our shorter-term indicators on the bullish side and more can join if price remains stable. It is, however, very unlikely that the technical damage we saw in the weeks prior resolves itself in a V shaped recovery. Most likely what we are going to see is continued choppy action with backing and filling before we can set a trend again.
For now my best guess on price path is for a continued move higher into the 2700/2750 area but probably only after a retest of 2450/2400 area. If we directly break 2370/50 area, then it means we are directly going to new lows. But as always, let us use our indicators to guide us in our trading. As I wrote on Friday, after a lot of experimenting and backtesting, I have arrived at a combination of indicators/signals to trade this volatile market effectively. The backtest results are very encouraging, so I will be using this method going forward. We will look to position ourselves with this system/method early in the coming week.
NYHL1M daily chart continues on sell signal.
Micro2 chart - continues on sell signal but getting close to a possible turn.
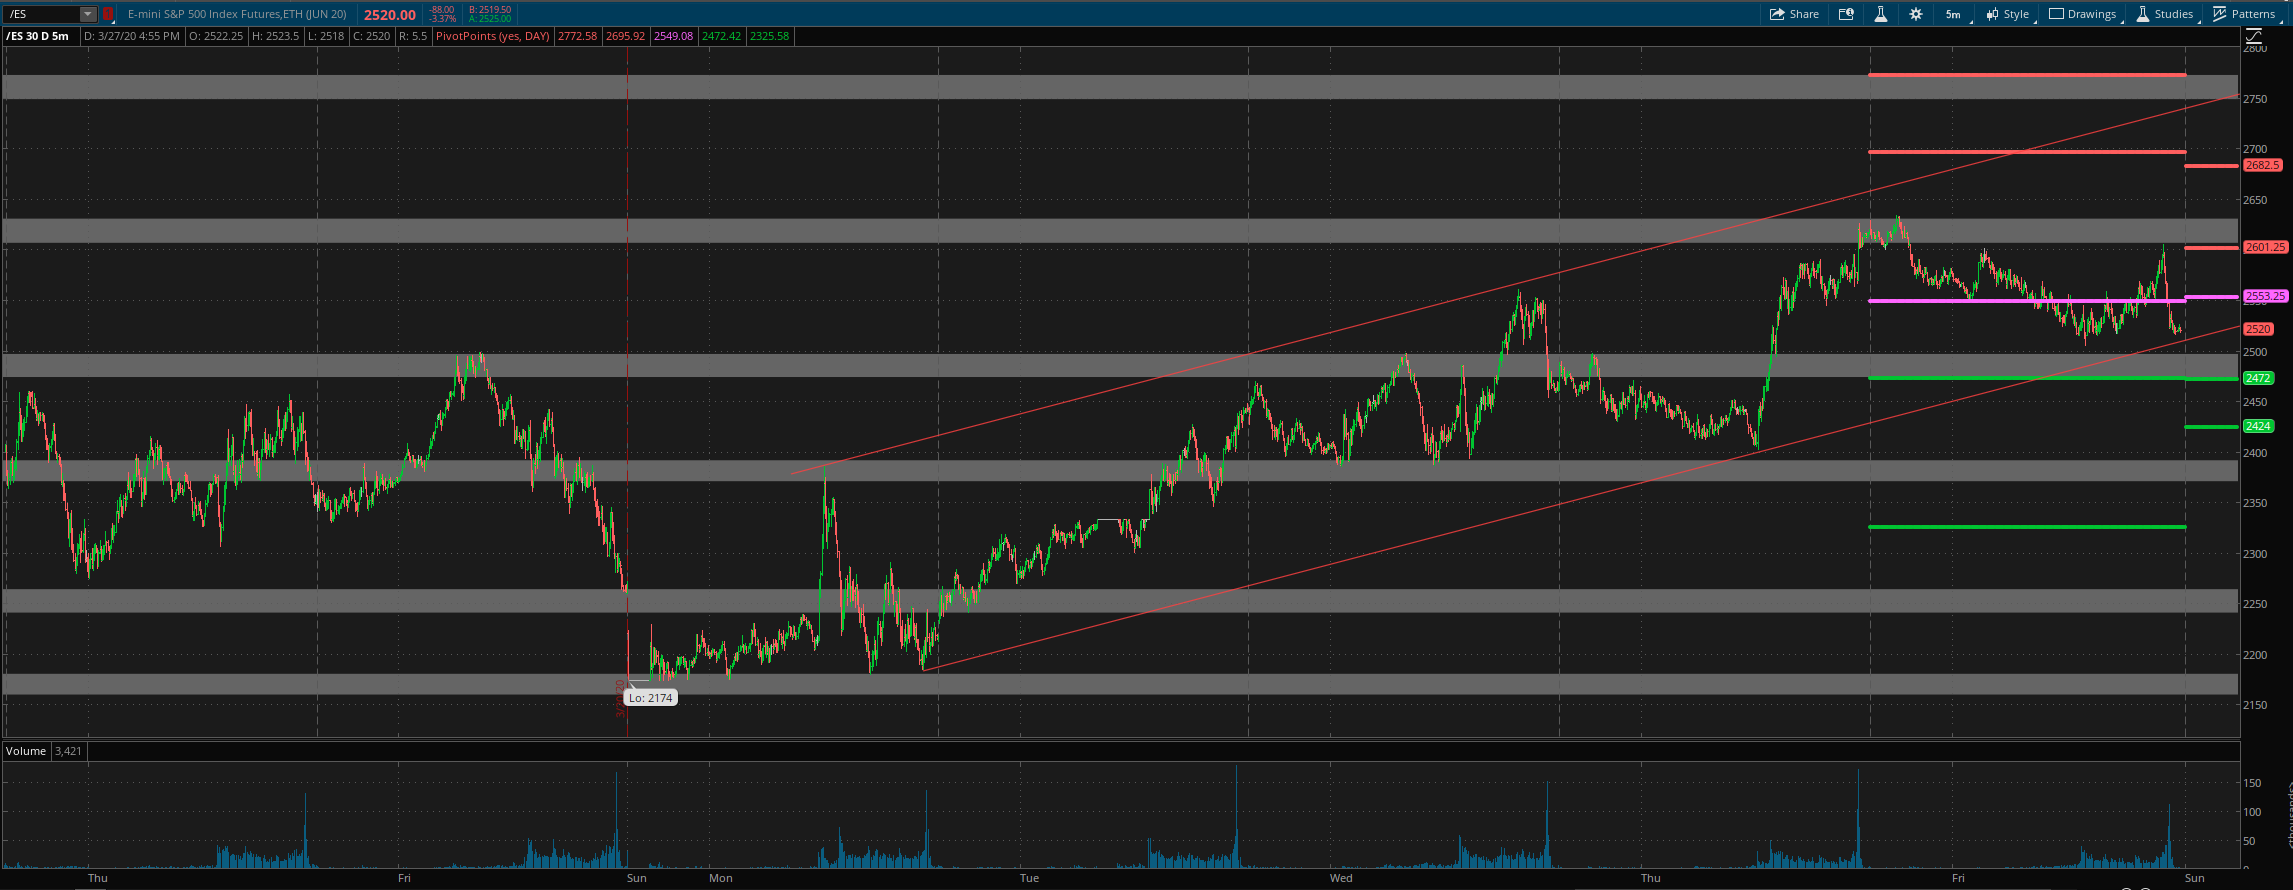
ES Grey Zone areas: The grey zones on the ES 5 min chart below are what I draw in on a discretionary basis -- they are supports and resistance areas which the market is most likely to react from. If we test a zone from below, it is likely to be rejected and fall lower to test support zones below. If we test a zone from above, it is likely to take support there and begin a move higher. So these zones can be used for intraday trading and/or as entry points for positioning for swing trades. These zones are drawn in based on what the market has done there previously both on smaller and larger timeframes.
Grey zone resistance at at 2607-30 and 2748-71. Support is at 2497-72 and then at 2390-71 area.
Daily pivot is at 2553. Resistance R1 is at 2601 and R2 at 2682.5. Support S1 is at 2472 and S2 at 2424.
All the best to your trading week ahead.


