Moving Higher On Deteriorating Internals
 By
By
In our report last weekend, we wrote: "With most of our indicators on a buy, we stay fully long in our LT portfolio and leveraged long in our trading portfolio. As I noted last week, the chances of us being bought from support areas back toward the highs was high probability and that is what has happened so far. I think there is a chance we may test the lows at 4620 area once more in the coming week but we do not have to. Regardless of whether we test those lows or not, I expect all time highs and higher very soon. Resistance to watch is at 4700/11 area and if that is taken out, 4740/50 and higher comes into play. And as usual - we stay long as long as our indicators support the trade."
What actually happened is that we tested the 4720 area on the Emini S&P 500 (ES), but ended the week more or less flat.
Looking ahead, internals are short-term toward the bearish side. Long-term is still bullish but getting weaker. Price action is short-term neutral to bullish, medium-term bullish and long-term bullish.
Indicators are mixed today with short term internal indicators toward the sell side. And price-based indicators are toward the buy side.
Overall our system still supports the long side, but is also suggesting to keep an eye on the exit because we are moving higher on deteriorating internal strength. However. as we saw in August 2020, this type of advance on bad breadth can continue for a while before we get a sell signal and a selloff. And it likely will take some weakness in price before the system goes to the sell side. Right now, price looks strong… and internals look weak ... but we trade price and so we have to give more importance to that. A turn is likely coming, but this can continue for some more time. So we stay long until the system gives us an exit and/or a short signal..
With regard to pivots and resistance, grey zone resistance at 4704-10 and then at 4717–24. Support is at 4690-84, 4673-66, 4647-41 and then at 4627-20.
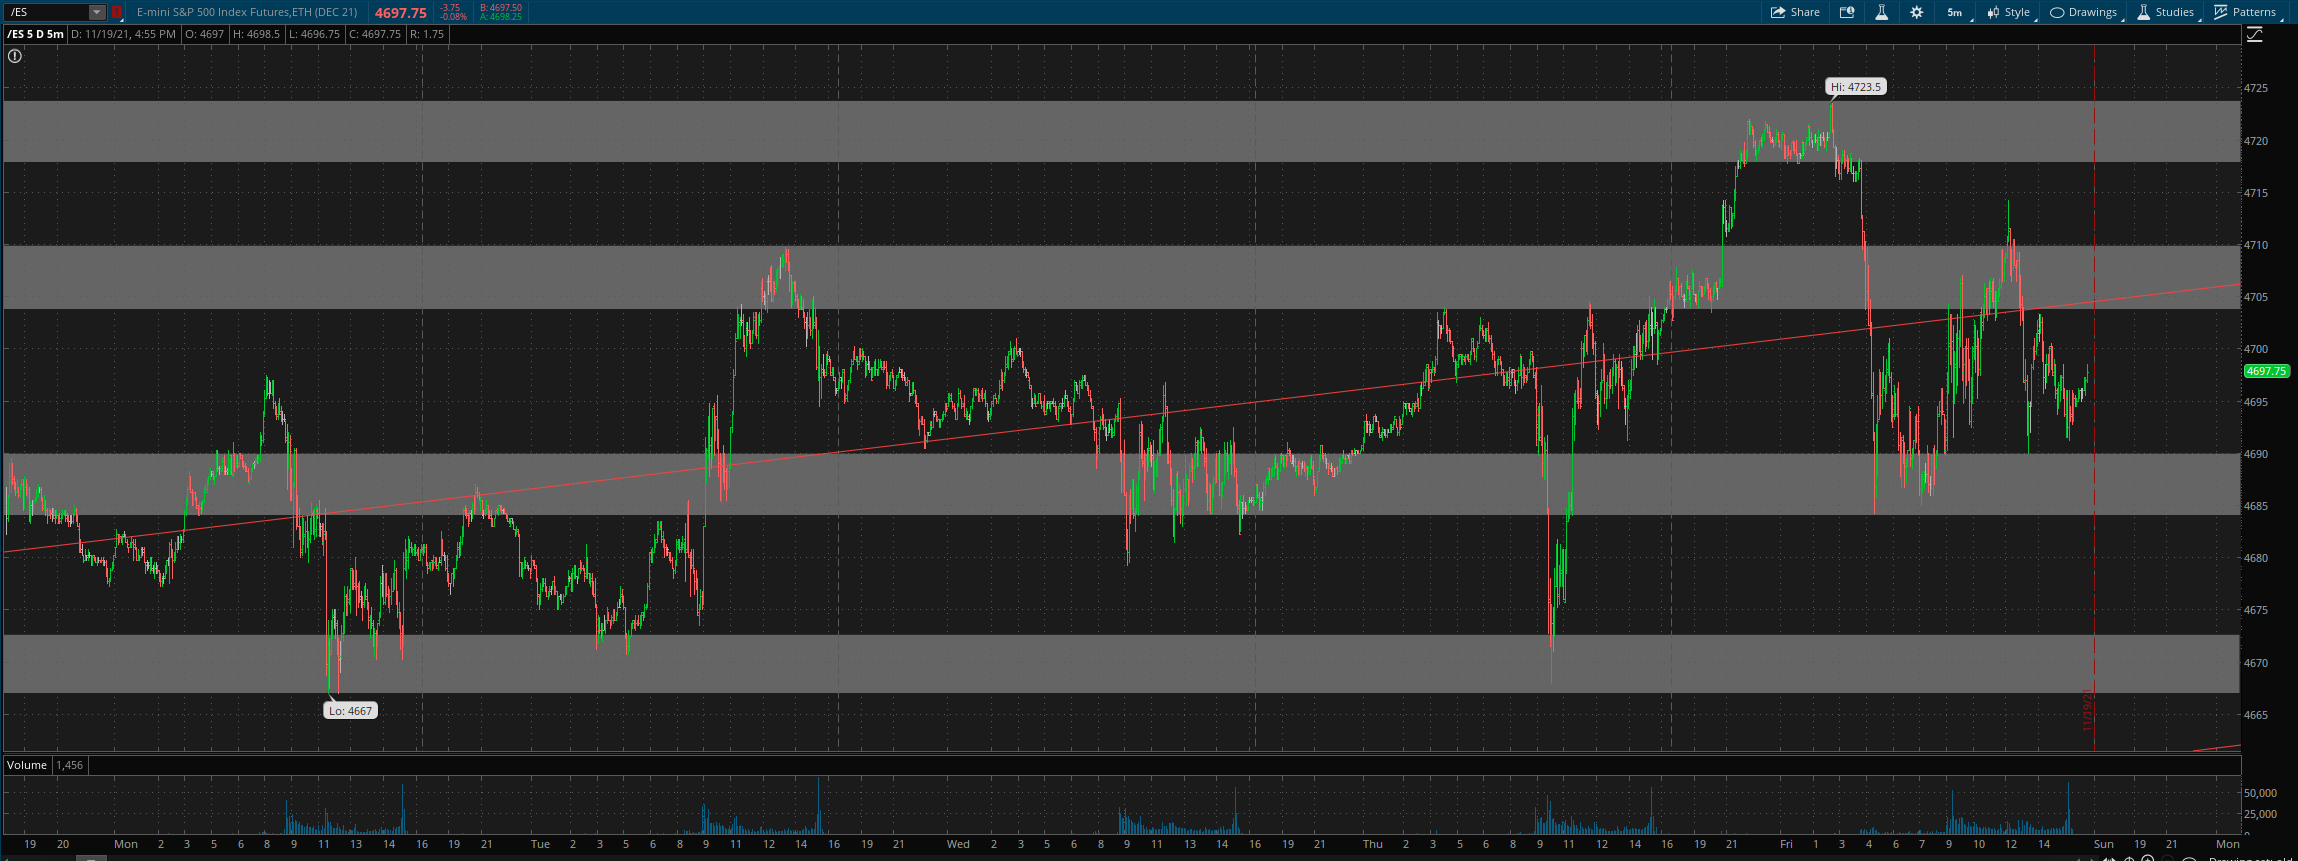
For Monday, daily pivot is at 4693. Resistance R1 is at 4718.5 and R2 at 4732. Support S1 is at 4680 and S2 at 4655.
All the best to your trading week ahead.
